
The 14 Best Commercial Real Estate Data Tools and Providers in 2026
U.S. commercial real estate traded $499 billion in 2025, up 22% from the year before (CBRE, February 2026). Every one of those deals was underwritten with data from a short list of commercial real estate data providers, and the list splits into three camps that get conflated constantly: marketplaces that show you what’s for sale, analytics platforms that tell you what assets are worth, and the growing layer of data that no vendor database sells at all.
Buy from the wrong camp and you pay CoStar money for a LoopNet problem. The pricing is opaque, the review coverage is thin, and the top-ranking comparison articles are mostly vendors ranking themselves first.
This guide compares the 14 best commercial real estate data tools of 2026 with two tables per provider: one for the core facts, one for verified review ratings with sample sizes printed. By the end you’ll have a shortlist matched to your asset class and workflow, plus realistic pricing expectations before any sales call.
Quick Digest
- Why CRE data is its own problem: Commercial real estate has no MLS equivalent; comps are private, leases are confidential, and ownership hides behind LLCs, so tool choice is coverage choice.
- The methodology that matters: Star ratings in this category are built on tiny samples. A 4.7 from 116 reviews and a 4.0 from 4 reviews are not comparable, so every rating below is printed with its sample size.
- The field at a glance: 14 tools across ten categories: managed data pipelines (Forage AI), full-suite database (CoStar), marketplaces (LoopNet, Crexi), ownership intelligence (Reonomy), comps (CompStak), market analytics (Yardi Matrix, Moody’s CRE, MSCI RCA, Green Street), debt (Trepp), integration (Cherre), foot traffic (Placer.ai), and parcel/environmental (LightBox).
- Top picks by niche: Yardi Matrix for multifamily, Trepp for CMBS and debt, CompStak for lease comps, Reonomy for off-market prospecting, Placer.ai for retail site selection.
- The pricing reality: CoStar Suite transacts at a median of roughly $40,000 per year per Vendr benchmarks; Reonomy sells self-serve plans from $400 a month; Crexi Intelligence starts at $299 per month; Cherre runs $150K to $500K annually. Most of the rest is quote-only.
Why Is Commercial Real Estate Data Its Own Problem?
Commercial real estate data is fragmented by design. Residential agents get an MLS; commercial teams get nothing equivalent. Sale prices in non-disclosure states never hit a public feed, lease terms sit inside confidential documents, and owners of record are routinely LLCs that exist to obscure the actual owner.
Expert Insights
“One of the challenges we have is that the news cycle is moving far faster today than the real estate performance cycle can move.” Jim Costello, Chief Economist at MSCI Real Assets, on why performance data that arrives monthly or annually keeps lagging the decisions it is supposed to inform (Propmodo, Decoding Real Estate podcast).
That fragmentation produced seven distinct data families. Each one originates somewhere different, and the origin tells you what a vendor can fix and what it can only repackage. No vendor covers all seven well:
| Data family | The question it answers | Where it originates | Tools below |
|---|---|---|---|
| Listings | What is on the market right now? | Broker and owner marketing, posted to marketplaces | LoopNet, Crexi |
| Sale and lease comps | What did it sell or lease for, and on what terms? | Broker, appraiser and researcher reporting, then analyst verification; sale prices in non-disclosure states never reach a public feed | CoStar, CompStak |
| Transactions and capital flows | Who is buying what, at what cap rate, with what financing? | Vendor-assembled deal records: sales, recapitalizations, financings, defaults | MSCI RCA, CoStar, Green Street |
| Ownership and debt | Who owns it, who lent on it, when does the loan mature? | Recorder and assessor records across 3,143 U.S. counties, with owners often behind LLCs; CMBS loan performance reporting | Reonomy, Trepp |
| Market analytics | What are rents, vacancy and the forecast by submarket? | Each vendor’s own survey and model, which is why two firms can publish different numbers for the same quarter | Yardi Matrix, Moody’s CRE, Green Street |
| Demand signals | How many people show up, and where do they come from? | Modeled from mobile-device panels: estimates, not counts | Placer.ai |
| Parcel and environmental | What are the boundaries, zoning and contamination risk? | County parcel and zoning records plus environmental records; the U.S. has no national parcel database | LightBox |
The vendors also disagree with each other on the same number. Moody’s put U.S. office vacancy at a record of roughly 21% across 79 markets in Q1 2026; CBRE’s read for the same quarter was 18.6% with positive net absorption. Neither is wrong. They track different building sets with different methodologies, which means whose data you buy quietly becomes whose market view you hold.
Note: A “CRE database” is not one thing. Marketplaces, comps databases, analytics platforms, debt data, and integration layers answer different questions. Most bad purchases in this category are category errors, not vendor errors.
This article covers commercial-only tools. If your scope includes residential and general property data, our companion guide to the best real estate data providers covers that market.
How We Evaluated These CRE Data Tools
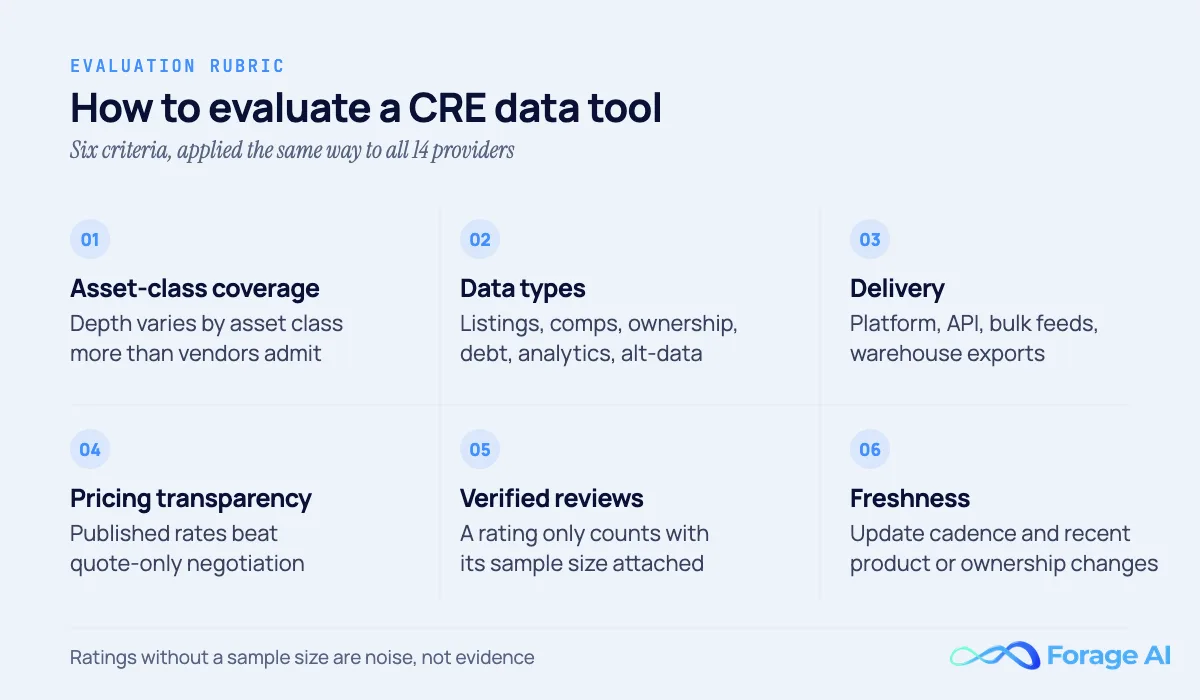
Six criteria, applied the same way to all 14 tools. No vendor paid for placement, and no ranking below is sponsored.
| Criterion | What we looked at | Why it matters |
|---|---|---|
| Asset-class coverage | Office, industrial, retail, multifamily, hospitality depth | Coverage varies more by asset class than vendors admit |
| Data types | Listings, comps, ownership, debt, analytics, alt-data | Determines which questions the tool can answer |
| Delivery | Platform, API, bulk feeds, exports | API access separates analysis tools from data sources |
| Pricing transparency | Published rates vs. quote-only, sourced benchmarks | Quote-only pricing shifts negotiating power to the vendor |
| Verified reviews | Ratings from G2, Capterra, Trustpilot, with sample sizes | Small samples make star ratings unreliable on their own |
| Freshness | Update cadence, 2025-2026 product and ownership changes | Stale comps and stale ownership records cost real money |
One criterion deserves the extra sentence. Review coverage for CRE data tools is remarkably thin: two category leaders have fewer than 10 G2 reviews, and one well-funded platform has zero. A 4.7 rating from 116 reviewers tells you something; a 4.0 from 4 reviewers tells you almost nothing. That is why every provider below gets a dedicated review table with the sample size (n) printed next to the rating, as of July 2026.
Getting this wrong is not a rounding error. Gartner’s oft-cited 2020 estimate puts the average cost of poor data quality at $12.9 million per organization per year. In a business where a single mispriced comp can move an offer by seven figures, the data budget is risk management.
Commercial Real Estate Data Tools at a Glance
Fourteen tools, ten categories, one line each. The deep dives with both tables follow.
| # | Tool | Category | Best for |
|---|---|---|---|
| 1 | Forage AI | Managed data pipeline | CRE data the databases don’t sell, built to your fields and delivered into your systems |
| 2 | CoStar | Full-suite database | Verified comps and coverage at institutional scale |
| 3 | LoopNet | Listings marketplace | Marketing availabilities and surveying on-market inventory |
| 4 | Crexi | Marketplace + analytics | An affordable CoStar alternative for SMB and midmarket teams |
| 5 | Reonomy (Altus Group) | Ownership intelligence | Off-market prospecting and LLC-piercing owner lookup |
| 6 | CompStak | Lease and sale comps | Lease economics: starting rents, TI, concessions |
| 7 | Yardi Matrix | Market intelligence | Multifamily and self-storage supply pipeline data |
| 8 | Moody’s CRE | Market analytics | Submarket forecasts for lenders and risk teams |
| 9 | MSCI Real Capital Analytics | Capital markets data | Institutional transaction records and price indices |
| 10 | Trepp | Debt and CMBS | Securitized loan performance and distress signals |
| 11 | Cherre (RealPage) | Data integration | Unifying internal and vendor data into one warehouse |
| 12 | Placer.ai | Foot traffic | Retail site selection and demand-side signals |
| 13 | LightBox | Parcel + environmental | Due-diligence data: parcels, zoning, Phase I ESA records |
| 14 | Green Street | Research + indices | Institutional research, CPPI, REIT analytics |
1. Forage AI: Best for Managed CRE Data Pipelines
What it is. Forage AI is not another database subscription. It is an end-to-end managed data pipeline: you define the commercial real estate fields you need and the systems they should land in, and Forage AI automates discovery, extraction, structuring, quality checks and delivery from public web sources, built to your schema. The service draws on extraction infrastructure spanning 500M+ websites. Every other tool on this list sells you a dataset it already collected; this model builds yours, and Forage AI never resells it.
| Core facts | Detail |
|---|---|
| Coverage | Any public web source: listing portals, tenant and franchise sites, county permit and zoning pages, distress notices, marketplace inventories |
| Data types | Listings and rents, tenant rosters, franchise footprints, permits, ownership signals, listing-velocity and vacancy proxies |
| Delivery | API, structured feeds (CSV/JSON), direct-to-warehouse; fully managed, with source changes handled as part of the service |
| Pricing model | Custom by scope; no per-seat licensing. From sign-off to first dataset in 1-2 weeks |
| Best for | Data and analytics teams at investors, lenders, and proptechs building proprietary CRE datasets |
Best for. Teams whose question is not “what did it trade for” but “what is happening on the ground that the databases can’t see”: which tenants are expanding, where permits are being filed, how fast listings move across marketplaces, what competitors are charging in rent. Proptech product teams also use this model to source the raw data behind their own analytics. Not for: anyone who needs a sale-comps database tomorrow; that is CoStar’s and CompStak’s territory, and Forage AI does not pretend otherwise.
| Reviews (as of July 2026) | Detail |
|---|---|
| G2 | Not listed |
| Capterra | Not listed |
What customers say. Forage AI is a managed service rather than self-serve software, so it does not accumulate marketplace reviews the way SaaS tools do; there is no G2 or Capterra listing to cite, and we won’t invent one. Client engagements run through scoped projects with a 3x QA team on every delivery.
The other thirteen tools on this list sell the databases themselves. The place to start is the one that defines the category.

2. CoStar: Best Overall CRE Database (If Budget Allows)
What it is. CoStar is the category incumbent: an analyst-verified database of properties, sale and lease comps, tenants and availabilities across every major commercial asset class, built by what its FY2025 10-K calls the largest research department in the commercial real estate industry. The scale of the moat shows up in the parent company’s accounts: CoStar Group booked $3.2 billion in revenue in 2025, up 19% year over year, with record Q4 net new bookings of $308 million. The company closed its $1.6 billion acquisition of Matterport in February 2025, folding 3D building capture into the platform, and in July 2026 it launched CoStar in France, starting with Paris, Lyon and Marseille.
| Core facts | Detail |
|---|---|
| Coverage | Office, industrial, retail, multifamily, hospitality, land; France added July 2026. Record and comp counts circulate in several versions, so we don’t print one |
| Data types | Verified sale/lease comps, listings, vacancy, rents, tenants, ownership, forecasts, analytics |
| Delivery | CoStar Suite platform + mobile; enterprise data licensing; no self-serve API for standard seats |
| Pricing model | Quote-only, long-term contracts. Vendr median: ~$40,000/yr for one license (up to 3 users), vs. ~$71,000 list. No published per-seat price |
| Best for | Institutional investors, large brokerages, and lenders that need verified comps at scale |
Best for. Teams that touch multiple asset classes and markets and can absorb five-figure annual pricing. If your underwriting depends on analyst-verified comps rather than crowdsourced or public-record data, CoStar remains the reference standard. Watch out for the contract structure: multi-year terms and opaque, negotiated pricing are standard, and the modules you actually need drive the real price. One legal footnote worth knowing: CoStar and Crexi remain in active litigation, with a 2025 appeals-court ruling reviving Crexi’s antitrust counterclaims and a CoStar copyright win over image copying. CoStar asked the Supreme Court to review the antitrust ruling in December 2025, and in March 2026 the Court declined, so those counterclaims proceed in the district court alongside CoStar’s copyright case. Both sides’ claims are unresolved as of October 2026.
| Reviews (as of July 2026) | Detail |
|---|---|
| G2 (CoStar Group, seller-level, all products) | 3.7/5 (n=203) |
| G2 (CoStar Investment Analysis) | 4.5/5 (n=10) |
| G2 (CoStar Brokerage Applications) | 3.7/5 (n=27) |
| Capterra | Listed; no verifiable rating at research time |
What customers say. Reviewers on G2 consistently praise the depth and verification of the comp database and the quality of market reports; the recurring complaints are price, contract inflexibility, and a steep learning curve. The seller-level 3.7/5 across 203 reviews blends products, which cuts both ways: it is the largest sample in this category and also the least product-specific.
Note: Don’t benchmark against the wrong CoStar product. “CoStar Real Estate Manager” scores 4.5/5 from 266 G2 reviews, but that is the lease-administration software, not the CoStar Suite data platform. Citing that rating in a data-tool evaluation is comparing apples to a different product line.
3. LoopNet: Best for Marketing and Surveying On-Market Listings
What it is. LoopNet, owned by CoStar Group, is the largest public-facing commercial listings marketplace. It answers one question well: what is on the market right now. It is not a comps database and does not try to be one; the data exhaust is marketing content, photos, and basic property facts.
| Core facts | Detail |
|---|---|
| Coverage | U.S.-wide for-sale and for-lease commercial listings, all major property types |
| Data types | Active listings, marketing media, basic property facts, market-trend content |
| Delivery | Web marketplace; advertiser dashboard |
| Pricing model | Published per-listing tiers: Silver $89, Gold $649, Platinum $1,249, Diamond $2,499 per listing/mo (LoopNet ad-package pages; third-party trackers report slightly different entry pricing, so treat tiers as directional) |
| Best for | Brokers marketing availabilities; buyers and tenants surveying on-market inventory |
Best for. Listing agents who need exposure, and any buyer or tenant doing a first-pass survey of what is publicly available. The structural catch: Basic (free) listings are visible only to CoStar subscribers, not the general public. If you list free, most of your intended audience never sees it, which is the quiet mechanism that converts free listers into paying advertisers.
| Reviews (as of July 2026) | Detail |
|---|---|
| G2 | 3.5/5 (review count not verifiable at research time) |
| Capterra | Listed; no verifiable rating at research time |
| Trustpilot | Listed; no verifiable score at research time |
What customers say. Praise centers on reach and ease of use; complaints center on the cost of premium tiers (G2 pricing data flags LoopNet at roughly 44% above category average) and on listing staleness, since expired or stale listings are a known marketplace-wide issue. The visibility rules for free listings are the most common surprise cited by first-time users.
4. Crexi: Best Affordable CoStar Alternative
What it is. Crexi is a commercial marketplace with an analytics layer, Crexi Intelligence, layered on top: sales comps, property records, and demographics with strong retail and industrial coverage. It has grown into the default first stop for SMB and midmarket teams priced out of the incumbent.
| Core facts | Detail |
|---|---|
| Coverage | National marketplace; comps and records depth strongest in primary and secondary markets |
| Data types | Listings, auctions, sales comps, property records, demographics, deal-management tools |
| Delivery | Web platform; PRO tier; auction platform |
| Pricing model | Free basic listings; Crexi Intelligence from $299/mo; PRO quote-based |
| Best for | SMB-to-midmarket brokers and investors wanting a modern, affordable platform |
Best for. Teams that need listings plus workable sales comps at a published price point. At $299 per month for Intelligence, a full year of Crexi costs less than a tenth of the Vendr median CoStar contract. Not for institutional underwriting that depends on deep historical comps or verified lease data; reviewers and the coverage record both point to thinner tertiary-market depth than the incumbent.
| Reviews (as of July 2026) | Detail |
|---|---|
| G2 | 4.7/5 (n=116) |
| Capterra (Crexi PRO) | 4.0/5 (n=1) |
| Trustpilot | 4.5/5 (n=3,126) |
What customers say. Crexi holds the strongest verified review profile of any tool on this list: 4.7/5 across 116 G2 reviews plus 4.5/5 across 3,126 Trustpilot reviews, samples large enough to mean something. Users praise the modern interface, lead-engagement analytics, and support responsiveness. Recurring complaints: comps depth and historical data are thinner than CoStar’s, with coverage gaps in smaller markets.
5. Reonomy (Altus Group): Best for Ownership Intelligence and Off-Market Prospecting
What it is. Reonomy is the ownership-intelligence platform: 53M+ to 55M+ commercial properties, depending on which Reonomy page you read, with entity resolution that pierces LLC structures to surface actual owners and their contact details. Altus Group acquired it for US$201.5M in 2021, and since May 27, 2026 Reonomy has sold self-serve subscriptions online, plans from $400 a month, a rarity in this category.
| Core facts | Detail |
|---|---|
| Coverage | 53M+ to 55M+ U.S. commercial properties (Reonomy’s own pages differ) |
| Data types | Ownership records, LLC-piercing entity resolution, owner contacts, sales, debt, tenant signals |
| Delivery | Web app; API; bulk data feeds (10,000+ records) priced on request |
| Pricing model | Self-serve per seat, plans from $400/mo; Monthly or Annual, with Annual saving 30% and 1,000 exports/mo included; bulk feeds and API through sales |
| Best for | Acquisitions teams, debt originators, and brokers doing off-market outreach |
Best for. Anyone whose deal flow depends on reaching owners before a listing exists. The LLC-piercing workflow is the differentiator: from parcel to person in one search. Watch out: contact-data hit rates are the recurring complaint, and at plans from $400 a seat per month the tool needs to convert prospecting into deals to pay for itself at a small shop.
| Reviews (as of July 2026) | Detail |
|---|---|
| G2 | 4.0/5 (n=4) |
| Capterra | Listed; no verifiable rating at research time |
What customers say. The G2 sample is four reviews: three five-star, one two-star. That is too thin to validate a platform this widely used, which is itself the takeaway: treat Reonomy’s rating as anecdote, not evidence, and lean on a trial instead. The positive reviews single out owner-contact discovery speed; the negative one cites data accuracy, mirroring the hit-rate complaint that shows up in practitioner forums.
6. CompStak: Best for Lease Comps
What it is. CompStak runs a crowdsourced comps exchange: brokers and appraisers trade lease and sale comps for credits, CompStak’s analysts review the submissions, and the cleaned dataset (4M+ comps, 1.7M+ properties) is sold to enterprises. It is the only tool on this list where the lease economics themselves, starting rent, tenant improvements, free rent, effective rent, are the core product.
| Core facts | Detail |
|---|---|
| Coverage | 4M+ comps across 1.7M+ U.S. properties; deepest in major metros |
| Data types | Analyst-reviewed lease comps (rents, TI, concessions, effective rents), sales comps, loan data |
| Delivery | CompStak Exchange (free for contributing brokers/appraisers), CompStak Enterprise (platform + API + feeds), Prospect |
| Pricing model | Exchange free-in-kind for producers; Enterprise quote-based, no public pricing |
| Best for | Appraisers, landlords, and institutional teams that live on lease economics |
Best for. Appraisers and landlords negotiating against asking rents with actual effective-rent data, and acquisitions teams underwriting rent rolls. The Exchange model means producers get the data free by contributing. Watch out: coverage follows the crowd, so major metros are deep and tertiary markets are sparse, and comp recency depends on submission activity in your market.
| Reviews (as of July 2026) | Detail |
|---|---|
| G2 (CompStak Exchange) | Insufficient reviews to rate |
| G2 (CompStak Enterprise) | No reviews (n=0) |
| Capterra | Not listed |
What customers say. There is no meaningful review-platform footprint despite a large broker user base, a common pattern for exchange-model tools whose users get the product free. Practitioner sentiment praises the concession-level lease detail unavailable anywhere else; the recurring gripe is metro concentration. With no usable star rating, judge CompStak on a sample pull for your specific market.
7. Yardi Matrix: Best for Multifamily and Supply-Pipeline Data
What it is. Yardi Matrix is the market-intelligence arm of property-management giant Yardi, with particular depth in multifamily and coverage of industrial, office, retail, self storage, and student housing. Yardi’s own pages give conflicting market counts, so we don’t print one; ask for the market list that matches your footprint. Its supply-pipeline and loan-maturity data are the reasons underwriters keep it in the stack.
| Core facts | Detail |
|---|---|
| Coverage | U.S., multifamily-led; market counts conflict across Yardi’s own pages, so confirm your markets |
| Data types | Property-level rents, occupancy, loan maturities, ownership contacts, new-supply pipeline, forecasts |
| Delivery | Platform subscription; research bulletins; data licensing |
| Pricing model | Quote-based, sized by markets, users, and property types; no public price list |
| Best for | Multifamily and self-storage investors and lenders underwriting supply risk |
Best for. Multifamily underwriting. If your model breaks when 3,000 new units deliver next year in your submarket, Matrix’s pipeline data is the tool built to catch it. The research team’s market bulletins are widely circulated and respected. Not for office- or retail-first teams: reviewers and practitioners consistently describe those modules as thinner than the multifamily core.
| Reviews (as of July 2026) | Detail |
|---|---|
| G2 | Listed; no verifiable rating at research time |
| Capterra | Not listed |
What customers say. No verifiable review base exists for Matrix itself. Practitioner praise concentrates on the supply pipeline and loan-maturity data; complaints mention a dated interface and quote-only pricing.
Note: Yardi Breeze ratings are not Yardi Matrix ratings. Capterra’s 4.2/5 (n=327) belongs to Yardi Breeze, the property-management product, and the “$1/unit/month” pricing that circulates in search results belongs to Breeze too. Neither number describes Matrix, the data platform.
8. Moody’s CRE: Best for Market Forecasts and Risk Teams
What it is. Moody’s CRE is the evolution of Reis, the submarket-analytics firm Moody’s acquired for $278M in 2018. The legacy Reis engine tracks rents, vacancy, cap rates, and construction across roughly 275 metros with time series running back decades, now wired into Moody’s broader risk and CMBS ecosystem with tenant and climate-risk layers.
| Core facts | Detail |
|---|---|
| Coverage | ~275 U.S. metros, submarket-level; decades-long time series |
| Data types | Submarket rents, vacancy, cap rates, forecasts, new construction, loan analytics, climate risk |
| Delivery | Platform, data feeds, API; integrates with Moody’s risk products |
| Pricing model | Quote-based; no public pricing |
| Best for | Lenders, institutional research teams, and risk management |
Best for. Credit and risk workflows. When a lender needs a defensible submarket forecast for a credit memo, Moody’s name on the data is part of what is being bought. Its office-vacancy series is the one that made headlines at a record ~21% in Q1 2026. Not for brokers who need property-level comps and a fast UI; the platform is built for analysts, and property-level granularity sits below CoStar’s.
| Reviews (as of July 2026) | Detail |
|---|---|
| G2 (Moody’s, seller-level, all products) | 4.2/5 (n=85) |
| G2 / Capterra (CRE product-specific) | None found |
What customers say. The 4.2/5 across 85 reviews covers Moody’s entire product family, not the CRE platform specifically; no CRE-specific review base exists. Practitioner sentiment credits the forecast rigor and submarket depth, while noting an enterprise sales process and a workflow aimed at research desks rather than deal teams.
9. MSCI Real Capital Analytics: Best for Capital-Markets Transaction Data
What it is. Real Capital Analytics, acquired by MSCI in 2021, is the institutional record of commercial property transactions: a global database built from US$42 trillion of transactions with insights spanning US$50T+ in CRE data, covering sales, recapitalizations, financings, defaults, and construction. Its price indices (RCA CPPI) and buyer/seller league tables are industry references.
| Core facts | Detail |
|---|---|
| Coverage | Global transaction coverage; deepest institutional record of deal flow |
| Data types | Transaction comps, league tables, cap-rate trends, CPPI indices, mortgage-debt intelligence |
| Delivery | Platform, data feeds; Capital Trends research reports |
| Pricing model | Enterprise quote-based; no public pricing |
| Best for | Institutional investors, capital-markets brokers, cross-border allocators |
Best for. Institutional capital-markets work: tracking who is buying what, at what cap rates, across borders. If your questions are about deal flow and pricing trends rather than individual property operations, this is the canonical source. Not for leasing or operational workflows, and small-balance deals are under-represented by design.
| Reviews (as of July 2026) | Detail |
|---|---|
| G2 | Not listed |
| Capterra | Not listed |
What customers say. Effectively no review-platform footprint, which is typical for enterprise data products sold to institutions rather than self-serve users. Market sentiment treats RCA data and the CPPI as reference-grade; the recurring practitioner note is that transaction focus means you still need a separate tool for leasing and operations.
10. Trepp: Best for CRE Debt and CMBS Data
What it is. Trepp, founded in 1979, maintains the largest commercially available database of securitized commercial mortgages and powers the Trepp-CREFC collateral performance database, an industry standard for CMBS. Loan-level performance, delinquency, special-servicing, and bank CRE-exposure analytics are the core product. In April 2026 Fitch Group agreed to acquire Trepp (reported around $1 billion), with a close expected in the second quarter; as of October 2026 we found no announcement that the deal had completed, so check ownership before you sign a multi-year contract.
| Core facts | Detail |
|---|---|
| Coverage | U.S. CMBS universe; CRE loan and maturity data; bank exposure |
| Data types | Loan-level CMBS performance, delinquency and special-servicing feeds, maturities, distress signals |
| Delivery | Platform, data feeds, API; TreppTalk research |
| Pricing model | Quote-based; no public pricing |
| Best for | Debt investors, banks, special servicers, and distress hunters |
Best for. Anyone working the debt side. Watchlist and special-servicing feeds surface distress quarters before it hits the news, which is why banks and opportunistic buyers keep Trepp on even lean budgets. Not for equity-side teams that never touch securitized debt; the fixed-income vocabulary is a real learning curve.
| Reviews (as of July 2026) | Detail |
|---|---|
| G2 | Insufficient reviews to rate |
| Capterra | Not listed |
What customers say. No usable review base exists. Practitioner sentiment is consistent: unmatched CMBS depth and a strong research desk, offset by enterprise pricing and a product built for fixed-income fluency.
11. Cherre: Best for Unifying Multiple CRE Data Sources
What it is. Cherre does not sell property data; it sells the pipes. The platform connects internal systems and third-party vendors (including MSCI) into a single resolved data warehouse with a GraphQL API, and says it resolves more than four billion entities across roughly $4 trillion in real assets. RealPage completed its acquisition of Cherre on July 14, 2026; Cherre says the platform stays open to any property management system and data source. Buying more data tools eventually creates the problem Cherre exists to fix.
| Core facts | Detail |
|---|---|
| Coverage | Integration layer: your vendors + public records + internal systems |
| Data types | Entity-resolved, unified CRE data graph; BI-ready warehouse |
| Delivery | Managed pipelines, GraphQL API, warehouse delivery |
| Pricing model | Custom annual contracts, typically ~$150K-$500K/yr; implementation extra in year one |
| Best for | Institutional owners and managers with multiple data sources and a data team |
Best for. Organizations already paying for three or more of the tools on this list and losing analyst hours reconciling them. Not for small teams: this is a six-figure infrastructure decision with a real implementation project attached, not a subscription you trial on a card. Since the RealPage deal, also ask how vendor neutrality and data-access terms are written into your contract.
| Reviews (as of July 2026) | Detail |
|---|---|
| G2 | No reviews (n=0) |
| TrustRadius | Listed; no verifiable score at research time |
What customers say. Zero G2 reviews despite institutional adoption, the most extreme example of this category’s review gap. Public case studies and press coverage emphasize entity resolution quality and the relief of a single source of truth; procurement-side commentary flags the price of entry and multi-quarter implementations.
12. Placer.ai: Best for Foot Traffic and Retail Site Selection
What it is. Placer.ai models foot traffic from a large mobile-location panel: 1.5B+ monthly visits modeled from roughly 20M devices across 13M+ venues. For retail and mixed-use CRE it answers the demand-side question the other tools can’t: how many people actually show up, where do they come from, and where else do they shop. Green Street integrated Placer.ai data into its U.S. platform in March 2026, a signal of foot traffic moving from novelty to standard input.
| Core facts | Detail |
|---|---|
| Coverage | U.S. venues and chains; 13M+ venues modeled |
| Data types | Visit trends, trade areas, visitor demographics, cross-shopping, chain rankings, void analysis |
| Delivery | Platform; API; limited free tier |
| Pricing model | Custom; reported ranges ~$12K-$50K+/yr enterprise; verified government contracts $8K-$27K/yr |
| Best for | Retail and mixed-use investors, site-selection teams, municipalities |
Best for. Retail site selection and leasing narratives: proving a corridor’s traffic to a tenant, or catching a center’s decline before the rent roll shows it. The honesty line: panel-based foot traffic is a modeled estimate, not ground truth. Accuracy is debated for low-traffic sites, so treat small-venue readings as directional.
| Reviews (as of July 2026) | Detail |
|---|---|
| G2 | 4.3/5 (n=10) |
| Capterra | No verified reviews |
What customers say. The G2 sample is ten reviews, thin for a platform this visible. Users praise the intuitive interface and benchmarking; the recurring caution, echoed in independent provider comparisons, is estimate accuracy at low-traffic locations. “Understanding granular, site-level footfall is critical to making confident real estate decisions,” as Green Street’s Chief Analytics Officer Andrew McCulloch put it when announcing the integration.
13. LightBox: Best for Parcel and Environmental Due-Diligence Data
What it is. LightBox is a roll-up of due-diligence data assets: SmartParcels (nationwide parcel fabric with 300+ property and tax attributes), EDR (the standard environmental-records source behind Phase I ESAs), RCM (the capital-markets deal platform claiming 84,000+ pre-qualified investors), and LightBox Vision mapping (formerly LandVision). In June 2025 it added UrbanFootprint’s climate and infrastructure layers.
| Core facts | Detail |
|---|---|
| Coverage | Nationwide U.S. parcel fabric; environmental records; deal-marketing data |
| Data types | Parcels and boundaries, zoning, environmental risk, building footprints, ownership |
| Delivery | Platform modules, bulk data licensing, API |
| Pricing model | Quote-based, modular by product; no public pricing |
| Best for | Environmental consultants, lender due-diligence teams, GIS and data teams |
Best for. The diligence phase: parcel boundaries, zoning, and environmental risk in one stack, with bulk licensing for GIS teams that want the parcel fabric itself. Not for comps or market analytics; LightBox sits upstream of the transaction, not inside it. Post-merger product fragmentation is the recurring practitioner complaint.
| Reviews (as of July 2026) | Detail |
|---|---|
| G2 | None found |
| Capterra | None found |
What customers say. Negligible review-platform footprint. Practitioner sentiment treats EDR as the default for environmental records and praises the parcel data’s geospatial delivery options, while noting quote-only pricing and a product suite still being stitched together from acquisitions.
14. Green Street: Best for Institutional Research and Price Indices
What it is. Green Street is the institutional research house of the group: U.S. and European market research, the Green Street Commercial Property Price Index (CPPI), and REIT analytics. With the March 2026 Placer.ai integration, its platform now blends research-grade indices with foot-traffic signals.
| Core facts | Detail |
|---|---|
| Coverage | U.S. + Europe institutional markets; REIT universe |
| Data types | Research, market forecasts, CPPI price indices, REIT analytics, foot-traffic overlay |
| Delivery | Research portal, data feeds |
| Pricing model | Quote-based; no public pricing |
| Best for | Institutional allocators and REIT investors |
Best for. Allocators and public-market investors who need independent research and a price index with a long track record. Not for deal-level work: no comps, no listings, no property-level operations data.
| Reviews (as of July 2026) | Detail |
|---|---|
| G2 | None found |
| Capterra | None found |
What customers say. No review-platform presence; Green Street sells research subscriptions to institutions, not self-serve software. Its reputation rests on the analyst desk’s track record, and the CPPI is cited across the industry as a benchmark alongside RCA’s.
Master Comparison: All 14 CRE Data Tools Side by Side
Fourteen deep dives later, the per-tool tables have answered “what is each one.” This table answers “how do they differ at a glance.” Ratings repeat the sample-size rule: no n, no weight.
| Tool | Category | Coverage signal | Pricing signal (as of Jul 2026) | Best-known rating (n) | Best for |
|---|---|---|---|---|---|
| Forage AI | Managed data pipeline | Any public web source | Custom by scope | Not listed (managed service) | Proprietary CRE datasets |
| CoStar | Full-suite database | Largest CRE research department (10-K) | ~$40K/yr Vendr median | 3.7/5 G2 (n=203, seller-level) | Verified comps at scale |
| LoopNet | Marketplace | Largest public listings pool | $89-$2,499/listing/mo | 3.5/5 G2 (n unverified) | Marketing listings |
| Crexi | Marketplace + analytics | National, modern platform | Intelligence from $299/mo | 4.7/5 G2 (n=116) | Affordable alternative |
| Reonomy | Ownership intelligence | 53M+ to 55M+ properties | Self-serve from $400/mo | 4.0/5 G2 (n=4) | Off-market prospecting |
| CompStak | Comps | 4M+ comps, 1.7M+ properties | Free exchange / quote | Insufficient reviews | Lease economics |
| Yardi Matrix | Market intelligence | Multifamily-deep; confirm market list | Quote-based | No verified reviews | Multifamily pipeline |
| Moody’s CRE | Market analytics | ~275 metros, decades of data | Quote-based | 4.2/5 G2 (n=85, all Moody’s) | Forecasts, risk |
| MSCI RCA | Capital markets | $42T transactions | Quote-based | Not listed | Institutional deal data |
| Trepp | Debt / CMBS | Largest securitized-loan DB | Quote-based | Insufficient reviews | Debt and distress |
| Cherre (RealPage) | Integration | Vendor-agnostic warehouse | ~$150K-500K/yr | No reviews (n=0) | Unifying sources |
| Placer.ai | Foot traffic | 13M+ venues modeled | ~$8K-50K/yr reported | 4.3/5 G2 (n=10) | Retail site selection |
| LightBox | Parcel + environmental | Nationwide parcel fabric | Quote-based | None found | Due diligence |
| Green Street | Research + indices | US + Europe institutional | Quote-based | None found | Allocator research |
How Do You Choose a Commercial Real Estate Data Tool?
The decision compresses to three questions asked in order: what do you own, what do you do with the data, and what will the stack cost.
Match the tool to your asset class
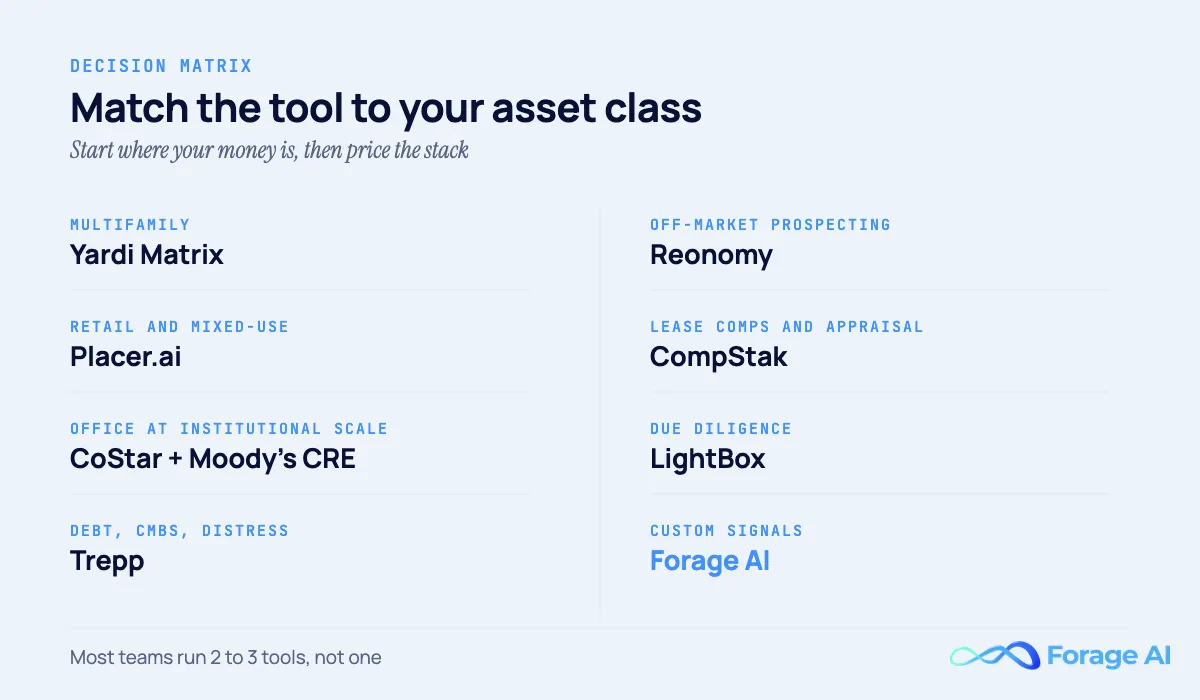
The conditional logic most articles refuse to give:
- Multifamily: Yardi Matrix first; CoStar if you also need office/retail comps
- Retail and mixed-use: Placer.ai for demand signals, plus CoStar or Crexi for comps
- Office at institutional scale: CoStar plus Moody’s CRE for the forecast layer
- Industrial: CoStar or Crexi for comps; Yardi Matrix also covers industrial markets
- Debt, CMBS, distress: Trepp, with MSCI RCA for transaction context
- Off-market acquisitions in any class: Reonomy
- Appraisal and lease negotiation: CompStak
- Land, development, environmental diligence: LightBox
Match the tool to your workflow
Prospecting teams live in ownership data (Reonomy). Underwriters live in comps and pipeline data (CoStar, CompStak, Yardi Matrix). Marketing and leasing live in the marketplaces (LoopNet, Crexi). Risk and research desks live in analytics (Moody’s, MSCI, Green Street, Trepp). The tools are not interchangeable across those rows, which is why 2 to 3 subscriptions per team is the norm rather than a failure of discipline.
The pricing reality
The verifiable numbers, checked July to October 2026: CoStar Suite transacts around a $40,000 annual median per Vendr’s benchmark data (list ~$71,000), and CoStar publishes no per-seat price. Reonomy’s self-serve plans start at $400 a month. Crexi Intelligence starts at $299 per month. LoopNet’s ad tiers run $89 to $2,499 per listing per month. Cherre contracts typically land between $150K and $500K annually. Everything else on this list is quote-only, and quote-only pricing is a negotiation, so benchmark before the call.
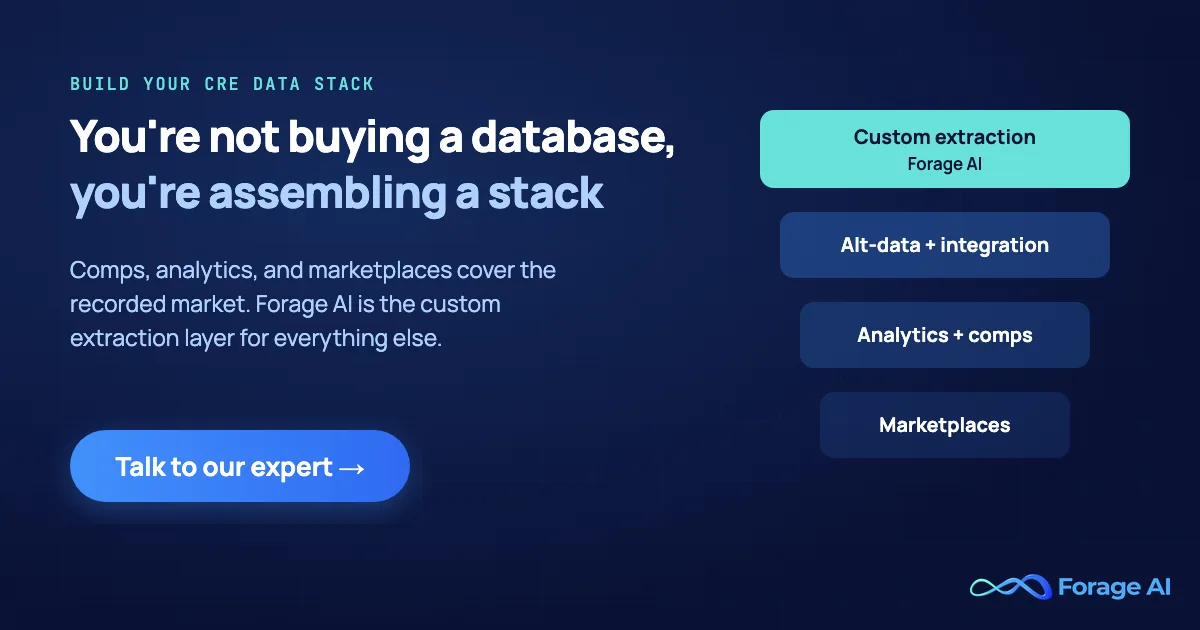
The incumbent’s accounts show what all that spending adds up to: CoStar Group collected $3.2 billion in 2025 while reporting net income of just $7 million, the gap driven by acquisition spending (Matterport, Domain) to widen the moat. The category is consolidating faster than it is commoditizing, and prices reflect it.
When you need more than one
Deloitte’s 2026 CRE Outlook survey (n=850+ executives) found 83% expecting revenue improvement and nearly 75% planning to increase real estate investment over the next 12 to 18 months. Growing books mean growing data stacks, and stacks create the reconciliation problem: the same building spelled three ways across three vendors. That is the point at which an integration layer like Cherre, or a purpose-built real estate analytics pipeline, stops being a luxury.
Deloitte’s 2026 Commercial Real Estate Outlook (850+ C-suite respondents, firms with $250M+ AUM) found only 7% report a transformative impact from AI so far, while 27% describe themselves as early-stage and 27% report rollout challenges. The gap between AI marketing and AI reality is a buying criterion: ask vendors what their “AI features” actually automate before paying for them.
When Is Off-the-Shelf CRE Data Not Enough?
Every tool above sells data someone already collected. The signals that increasingly move CRE decisions were never collected in the first place: tenant rosters and franchise footprints scattered across brand websites, permits and zoning agendas sitting on county pages, distress notices in legal filings, listing velocity across marketplaces, competitors’ advertised rents.
The demand side of that shift is measurable. Alternative-data adoption reached 90% of institutional-investor respondents in Lowenstein Sandler’s 2025 survey (n=107, across institutional investing broadly, published February 2026). Green Street folding Placer.ai foot traffic into its platform is the same trend from the supply side: alt-data moving from edge to default.
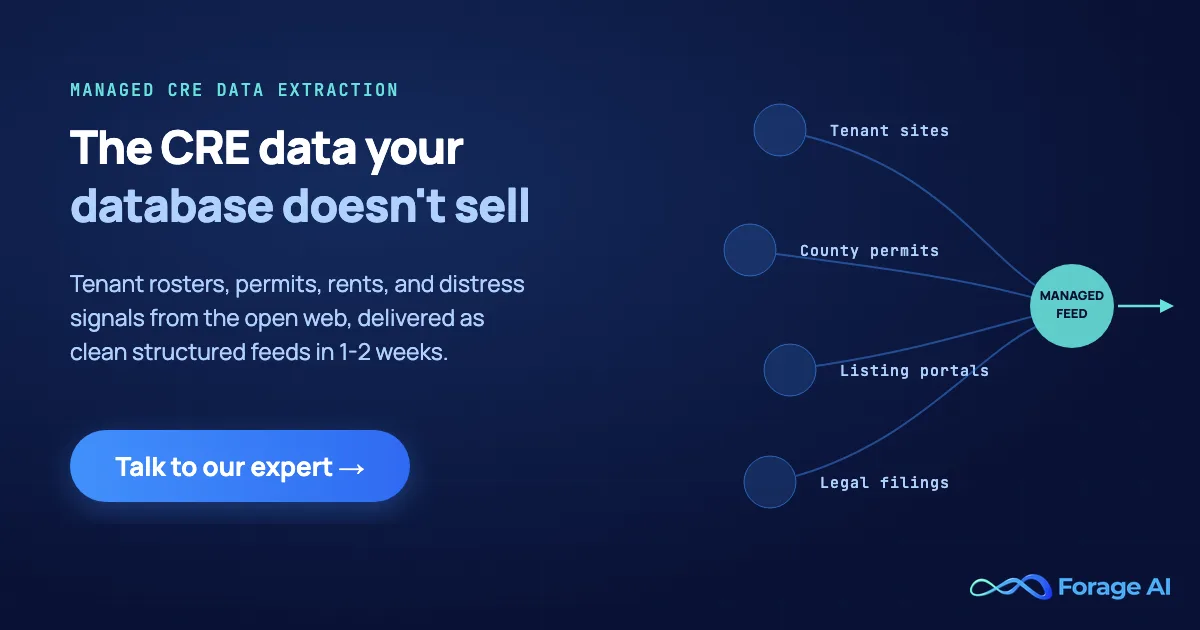
When the data you need lives on the open web rather than in a vendor database, the options are building an in-house scraping operation, with the maintenance burden that tracking web data at scale actually carries, or using a managed service. Forage AI delivers the data, not just the pipeline: an end-to-end managed data pipeline that automates discovery, extraction, structuring, quality checks and delivery, built to your fields and systems, from sign-off to first dataset in 1-2 weeks. For CRE teams, that means listing and rent monitoring, tenant and location data, and permit tracking that no packaged tool carries.
Why Forage AI for Commercial Real Estate Data?
Forage AI does not compete with the databases above. It builds the dataset none of them carry: an end-to-end managed data pipeline that automates discovery, extraction, structuring, quality checks and delivery of CRE signals from the open web, built to your own fields and systems. Every delivery passes a 3x QA team before it lands, and the first dataset arrives 1-2 weeks after sign-off.
Choose Forage AI if your edge depends on signals no vendor sells, such as tenant expansion, permit filings, listing velocity or competitor rents, and you want them delivered into your warehouse without running scrapers yourself.
Choose a CRE database subscription if you need verified sale and lease comps, CMBS loan performance or submarket forecasts this quarter. That is collected history, and the tools above already hold it.
FAQ
What is the best source of commercial real estate data?
It depends on the question you are asking the data. CoStar is the broadest verified database; Crexi is the best-reviewed affordable platform (4.7/5 on G2, n=116); Yardi Matrix leads multifamily; Trepp leads debt; CompStak leads lease comps. Teams typically combine 2 to 3 sources because no single vendor covers listings, comps, ownership, analytics, and demand signals at once.
How much does CoStar cost?
CoStar does not publish pricing. As of July 2026, Vendr’s transaction benchmarks put the median CoStar Suite contract around $40,000 per year for one license covering up to three users, against a list price near $71,000. No per-seat price is published, and the seat figures that circulate online carry no source. Multi-year contracts are standard, so the negotiated first-year number sets the baseline for years two and three.
Are there free commercial real estate databases?
Partially. LoopNet and Crexi offer free listing search, CompStak Exchange gives brokers and appraisers comps free in exchange for contributing their own, and county assessor and recorder sites expose ownership and transaction records at no cost. The catch is coverage and labor: free sources answer single-property questions but do not scale to portfolio screening, which is what the paid tools and custom extraction actually sell.
What is the difference between CoStar and LoopNet?
Same parent company, different jobs. CoStar is the research database: verified comps, analytics, and market data for subscribers. LoopNet is the public marketing marketplace where listings are advertised. A common misconception is that a free LoopNet listing reaches everyone; Basic listings are visible only to CoStar subscribers, which is precisely what the paid tiers ($89 to $2,499 per listing per month) exist to fix.
Why do lenders use commercial real estate data and analytics?
Because loan performance depends on market variables the borrower’s pro forma doesn’t control: submarket vacancy, new supply, rent trajectories, and loan maturities. Lenders lean on Moody’s CRE for submarket forecasts, Trepp for securitized-loan performance and early distress signals, and increasingly on real estate data APIs to pull those feeds into internal credit models.
How accurate is foot traffic data?
Foot-traffic platforms model visits from mobile-device panels, so every number is an estimate, not a count. Placer.ai models 1.5B+ monthly visits from roughly 20M devices; accuracy is strongest for high-traffic venues and debated for low-traffic sites. Treat readings as directional, validate against a known property in your own portfolio, and be cautious with small venues.
The Stack Is the Product
The habit this market needs to break is asking “which CRE database should we buy” as if the answer were one name. The 2021-2026 consolidation wave already answered differently: CoStar bought Matterport and the marketplaces, Altus bought Reonomy, Moody’s bought Reis, MSCI bought RCA, RealPage bought Cherre, and Fitch agreed to buy Trepp. The vendors themselves are assembling stacks.
Buyers should do the same. Pick the comps engine your asset class demands, add the workflow tool your team actually opens daily, price the pair honestly, and route the signals no database sells through custom extraction. A $499 billion transaction market is not underwritten on one subscription, and the teams that outperform stopped pretending it could be.
Ready to build the dataset your vendors don’t sell?
Talk to Forage AI about a managed CRE data pipeline.
Related Articles
- The Best Real Estate Data Providers 2026: The general-market companion covering residential and full-spectrum providers
- Real Estate Data Analytics: How Property Teams Automate Market Intelligence: How to turn provider feeds into decision-grade analytics
- Real Estate Data API: What to Expect and How to Evaluate Providers: The evaluation framework for API-first delivery
- Point of Interest (POI) & Hyperlocal Data Providers: The POI and location-data layer adjacent to foot traffic
Sai is a data infrastructure enthusiast who has spent the past two to three years following the AI space closely, from the infrastructure layer to the fast-growing world of data for AI. He is genuinely curious about how modern data pipelines get built and where the data industry is heading, and he writes insightful pieces on the core topics that shape this niche.