JLL’s 2025 Real Estate AI Reality Check found that 90% of RE companies are piloting AI, and 5% have achieved their AI goals. JLL explicitly named the gap: data quality, infrastructure readiness, and change management. Not the model layer. The data layer beneath it.
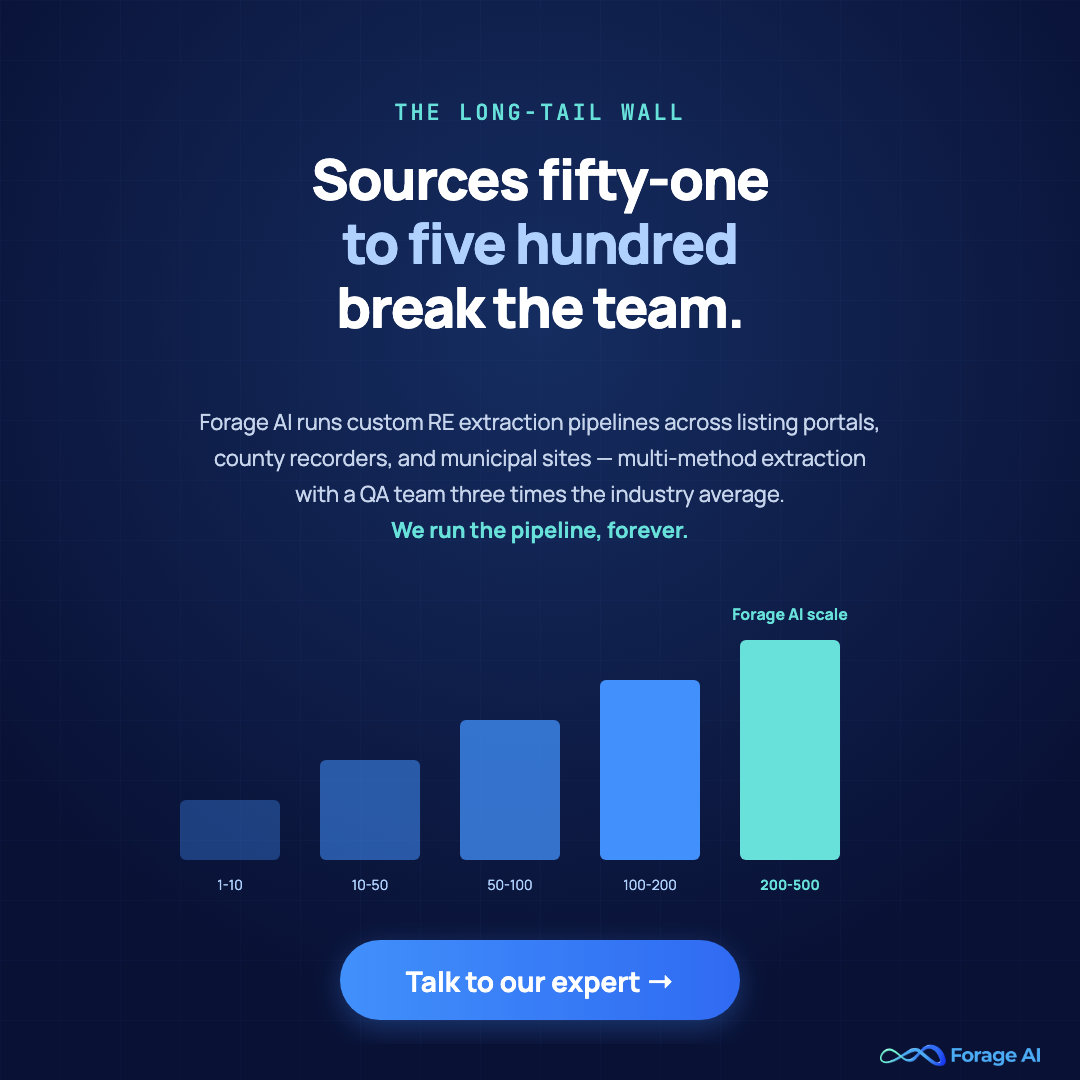
Most articles ranking for “real estate data analytics” explain the dashboard. This one explains the pipeline that makes the dashboard possible, and why most pipelines silently break between source #51 and source #200, where the long tail of MLSs, county recorders, and listing portals stops behaving like the first fifty.
What Real Estate Data Analytics Actually Is and What the SaaS Pitch Misses
Real estate data analytics is the analytical output of an operational data pipeline: pricing intelligence, market intelligence, portfolio analytics, leading-indicator forecasting, derived from listings, transactions, ownership records, zoning, permits, alt-data, and competitor signals. It is not a SaaS dashboard. The dashboard is what the executive sees; the pipeline is what you actually own. If your MLS feed is stale or your AVM thin, the dashboard cannot recover it. JLL’s 2025 finding is a data-layer outcome, not a model outcome, and the 60% of RE investors lacking a unified tech strategy (JLL, 2025) are the ones who feel it first.
In production, RE data analytics does four jobs: pricing and valuation (AVMs, comps), market intelligence and competitor monitoring (DOM, pricing pressure), portfolio analytics (cap rate, NOI, tenant risk), and leading-indicator forecasting (permits, business registrations, Construction-to-Absorption Ratio, Population-Adjusted Job Growth). Each is bounded by the freshness, completeness, and structure of what enters the pipeline. For the upstream definitional ground, see “Real Estate Data Fundamentals.”
Expert Insight: The dashboard cannot tell you that 12% of last week’s competitor listings were served from a cached anti-bot page and never made it into the comps. That’s a pipeline-layer signal, and most analytics products are blind to it.
Quick Summary: Analytics quality is bounded by what the five stages beneath the dashboard produce. Most ranking content treats those stages as a black box.
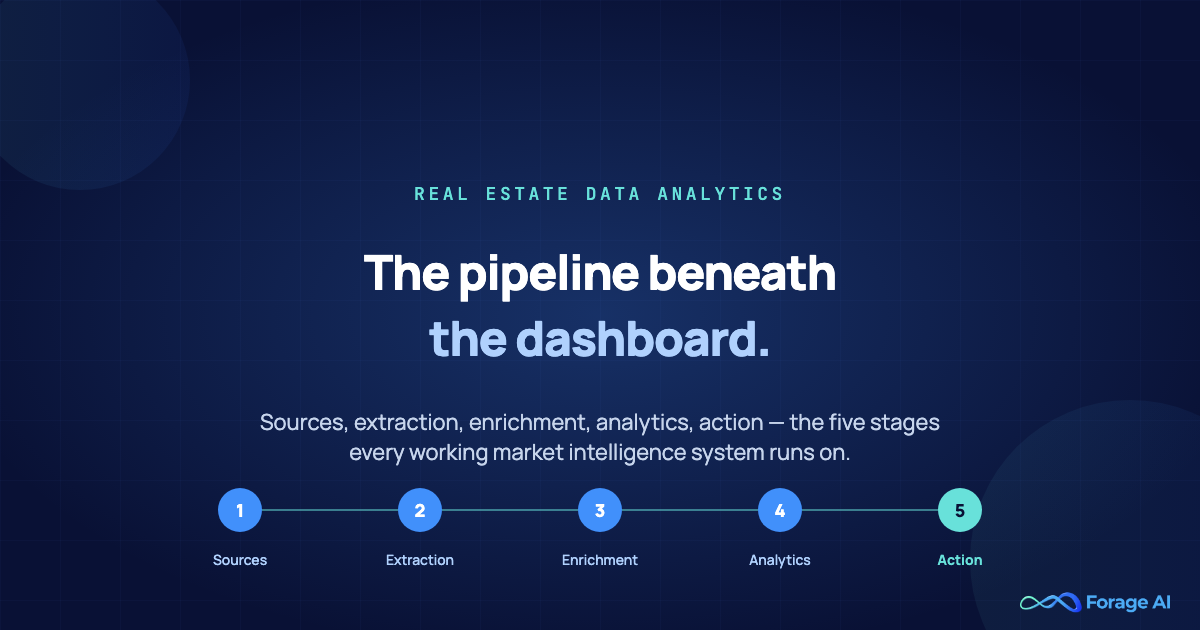
The Five-Stage Pipeline Behind Every Working RE Market Intelligence System
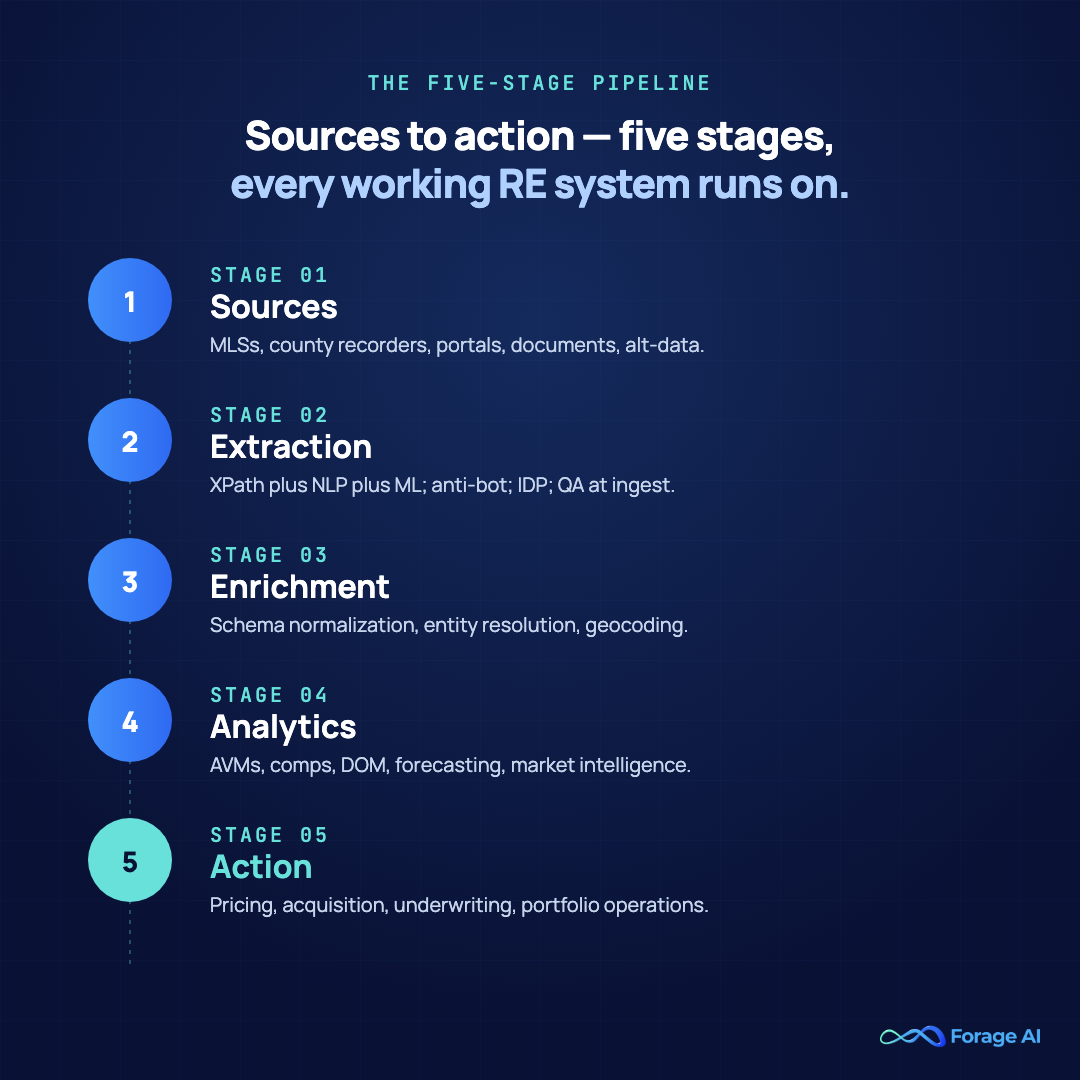
Every working market-intelligence system in real estate runs the same five stages, whether teams name them or not: Sources → Extraction → Enrichment → Analytics → Action. Most ranking pages start at stage four. Stages one through three are where the bookmark-worthy work lives, and where the failures hide.
[ Sources ] → [ Extraction ] → [ Enrichment ] → [ Analytics ] → [ Action ]
   MLSs           XPath +          Normalization      AVM /          Pricing /
   Counties        NLP + ML         Entity res.        Comps /        Acquisition /
   Portals        IDP              Geocoding          Forecasting    Underwriting
   Documents      Anti-bot         Schema mapping     Market intel   Portfolio ops
   Alt-data       QA at ingest     De-duplication     Vector DB      Customer-facing
Ownership maps cleanly: data engineering owns stages 1–2, data engineering and analytics share stage 3, analytics owns stage 4, the investment or product team owns stage 5. The handoff between stages 2 and 3 is where most silent failures occur: extraction reports a clean run, but enrichment is fed misaligned schemas or duplicate parcels.
Two myths to name. First, “we’ll figure out sources after we build the analytics”: analytics on un-architected sources is a rebuild waiting for a customer complaint. Second, “one tool covers all five stages”: no single tool does, and pretending one does is how stage 2 silently degrades. The full discipline upstream is closer to automated data collection workflows than to “a few scrapers and a warehouse.”
Expert Insight: The five-stage frame is a contract. Each stage has an owner, a primary input, a primary output, and a primary failure mode. Pipelines that survive year two are those in which each slot is named and monitored.
Quick Summary: The bottleneck almost always lives at a stage you don’t own with the same rigor as the others, and you can’t fix what you can’t locate.
The Dataset Source Map — What to Extract, Where It Lives, How Fresh It Needs to Be
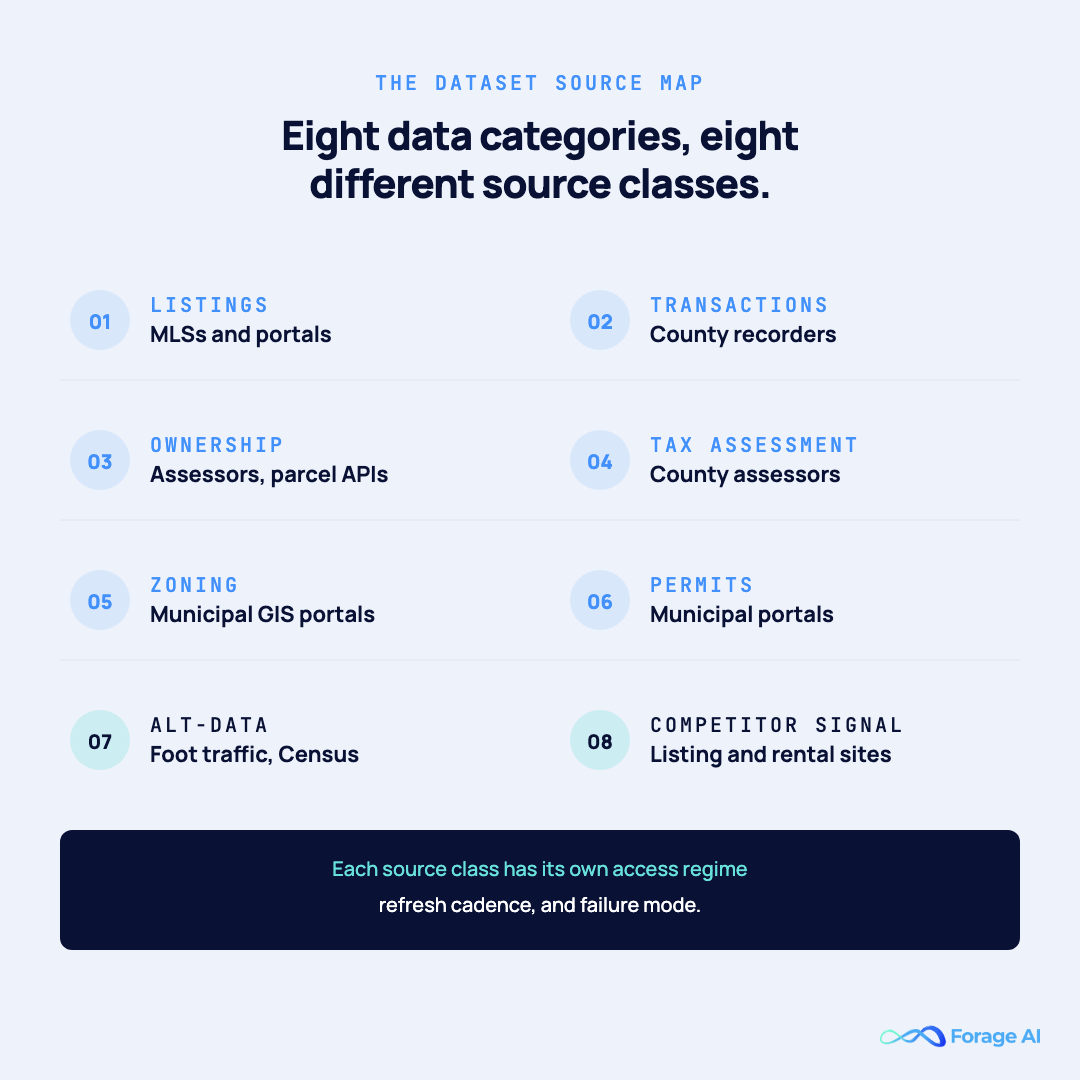
Real estate market intelligence is fed by eight data categories. Each lives in a different source class with a different access regime, refresh cadence, and failure mode:
| Data Type | Primary Source | Extraction Method | Refresh Cadence | Primary Failure Mode |
|---|---|---|---|---|
| Listings (active, pending, sold) | MLSs (484 in US), Zillow, Redfin, Realtor.com | RESO Web API where licensed; custom extraction on portals | Sub-day to real-time | License churn; anti-bot escalation; XPath drift on JS-rendered fields |
| Transactions / Deeds | 3,600+ county recorder offices | IDP on PDF/scanned filings; some county APIs | Weekly to monthly per county | Format variance per county; OCR brittleness on scans |
| Ownership / Parcel | County assessors; CoreLogic, ATTOM | Pre-built API for breadth; custom for niche jurisdictions | Quarterly | Entity-resolution gaps (LLC chains across registries) |
| Tax Assessment | County assessors | Public-records portal extraction; some open data | Quarterly to annual | Lag between assessment year and current value |
| Zoning / Land Use | Municipal GIS / Esri portals | GIS API + portal extraction | On-change | Jurisdiction-specific terminology; no national schema |
| Building Permits | Municipal permit portals | Custom extraction; semi-structured forms | Weekly | Portal format variance; partial fields per municipality |
| Alternative Data | Placer.ai, Census, foot-traffic, business registrations | Provider API; Secretary of State extraction | Daily to monthly | Provider TOS; coverage gaps in tertiary geographies |
| Competitor Monitoring | Listings portals, iBuyer websites, rental platforms | Change monitoring + custom extraction | Sub-hour for pricing; daily for inventory | Anti-bot escalation; cache-served degraded responses |
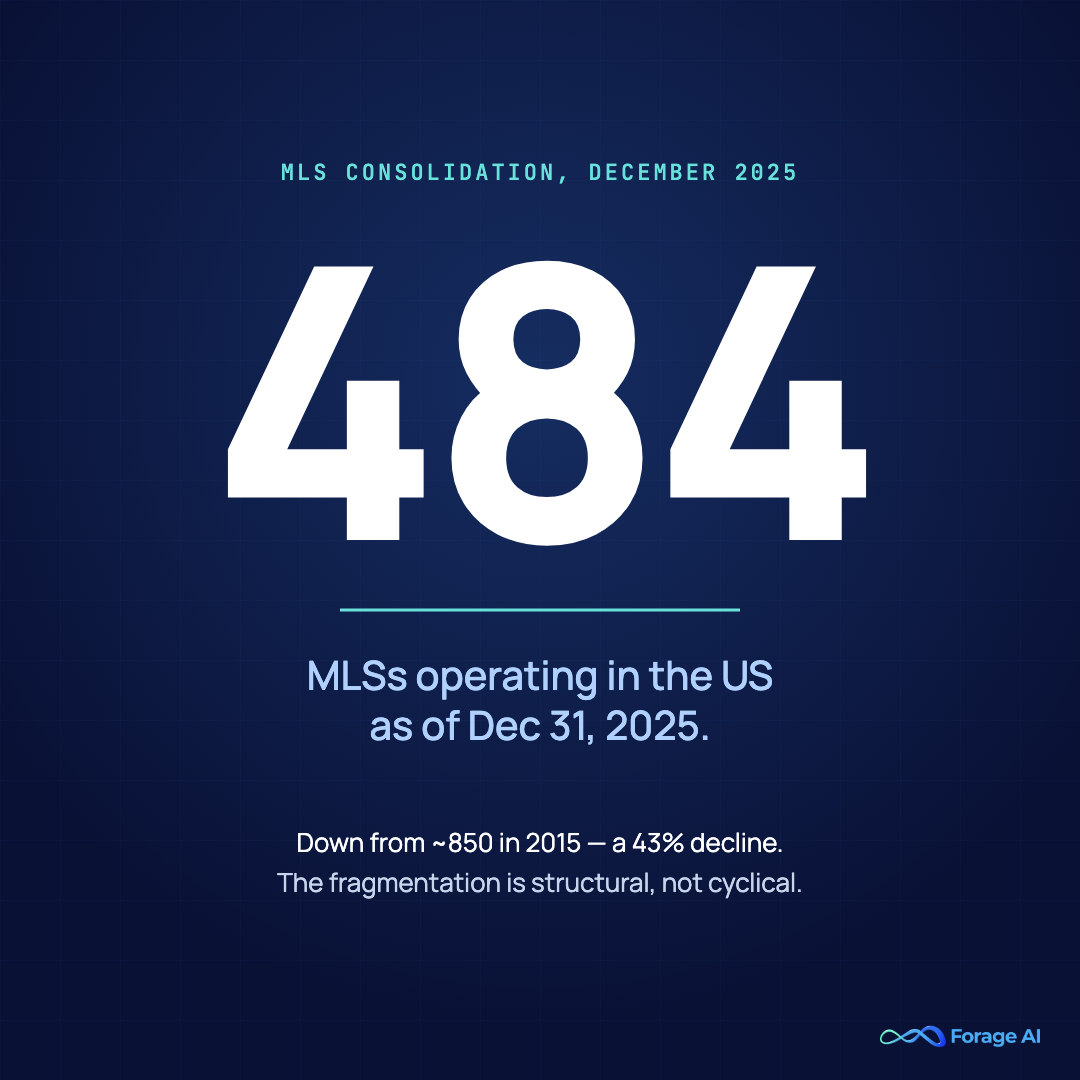
Stat Callout: 484 MLSs as of December 31, 2025, down from ~850 in 2015 (43% decline). T3 Sixty / Real Estate News, March 4, 2026. The fragmentation is structural, not cyclical. Every consolidation redraws the licensing and schema boundaries your extraction layer tracks.
The refresh-cadence question is the one most teams get wrong. The operational answer to “how fresh does it need to be”: fresh enough that your analytics doesn’t lie about a competitor’s price for more than an hour. Over-fresh is wasted compute; under-fresh feeds wrong analytics. Map cadence to intent.
Two breadth misconceptions. MLS-is-enough fails: MLS is licensing-restricted, residential-skewed, structurally disrupted post-NAR settlement, and misses transactions, ownership chain, zoning, permits, and competitor signal. 93% of US MLSs are RESO-certified and 75%+ on the RESO Web API (Real Estate News, 2025), standardization closing in, not solved. Pre-built-API-is-enough fails because ATTOM, CoreLogic, HouseCanary give breadth (CoreLogic covers 99%+ of US properties) but not custom fields, niche geographies, competitor monitoring, or document-derived ownership chains. For the investor-side application, see investor thesis with web data.
Expert Insight: Coverage breadth is the metric vendors compete on. Coverage correctness at last refresh is the metric your data product lives or dies by. A 99% parcel count tells you nothing about the second one.
Quick Summary: Most working market-intelligence stacks are hybrid by design: pre-built for breadth on stable categories, custom extraction for niche fields, competitor signal, and document layers.
Why Most Teams Underestimate Web Data Extraction
At scale, web extraction is a discipline, not “scraping a few websites”: multi-method extraction (XPath + NLP + custom ML), anti-bot handling, schema versioning, QA at ingest, refresh orchestration per source class.
Four operational realities define RE extraction at scale. First, anti-bot infrastructure on Zillow, Redfin, and Realtor.com is now PerimeterX/HUMAN-class (TLS fingerprinting, JS challenge rotation, behavioral detection), defeated only by the right proxy infrastructure and full browser-context rotation, not header tweaks. Second, MLS licensing terms shift mid-year: the NAR settlement broke compensation fields out of every feed in 2024, and IDX policy is still litigated. Third, county recorder websites range from RESTful APIs to scanned-PDF directories: one data category, four extraction methods per state. Fourth, listing pages dynamically render fields that break fragile XPath weekly; XPath-only extraction is a 12-month liability.
Decision logic: if you control all sources at a modest scale on public APIs, in-house works. If 50+ sources, dynamic anti-bot, and county-by-county document parsing, in-house, get expensive fast and break silently. The long-tail wall: sources 1–50 scale fine, sources 51–500 break the team.
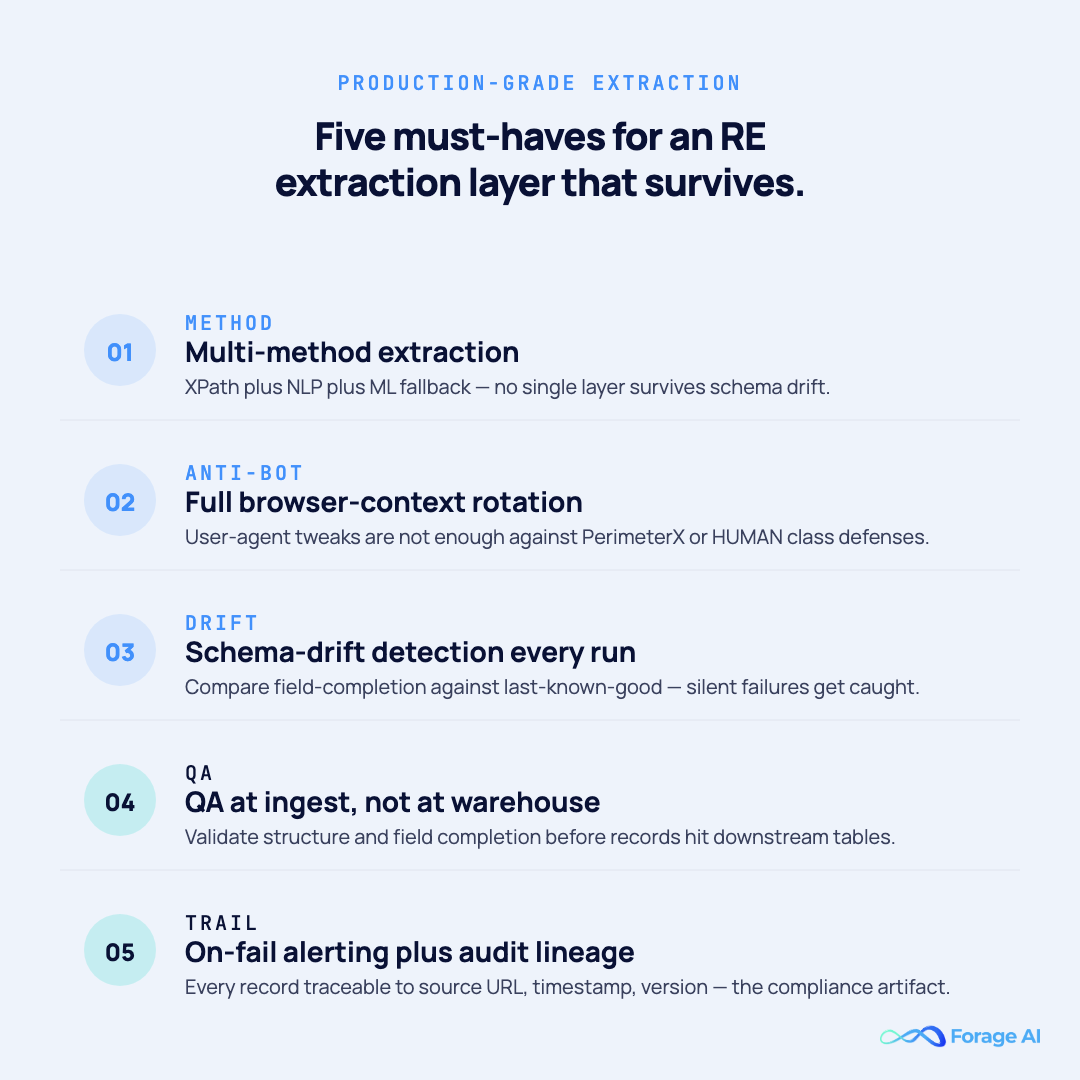
Is your extraction layer production-grade? A 7-item check:
- Multi-method extraction (XPath + NLP + ML fallback)
- Anti-bot rotation (full browser context, not just user-agent)
- Schema-drift detection at every run
- QA at ingest (field-completion + structural validation)
- Refresh-cadence SLA per source class
- On-fail alerting with last-known-good comparison
- Audit/lineage trail back to source URL, timestamp, version
CFAA risk is low post-hiQ v. LinkedIn; the real risk profile is contract liability on portal TOS. For the legal contour, see compliant data collection.
Forage AI in this layer. Forage runs RE extraction pipelines at this scale for data-product teams: multi-method extraction across MLS-licensed feeds, listing portals, county recorder websites, and municipal portals, with a QA team three times the industry average and schema-drift detection at every run. We run the pipeline, forever. Your team owns the data product.
Expert Insight: The pipelines that survive are not the ones with the cleverest selectors. They are the ones with the most ruthless QA layer, because in 2026 the failure mode is not “the scraper crashed.” It is “the scraper succeeded and returned the wrong thing.”
Quick Summary: Extraction has been commoditized at the public API surface. Everything beyond that (portals, counties, permits, documents) is custom work, where the data product’s defensibility lives.
The Document Layer — Title Deeds, Leases, Permits, Zoning (IDP for Market Intelligence)
Half of market-intelligence input is documents, not websites: title docs, deeds, leases, offering memorandums, building permits, zoning ordinances. Almost no analytics-framed content covers this layer, which is why CRE-leaning teams find their market intelligence stops at the parcel boundary and never reaches ownership chain, lease terms, or permit history.
Five document classes, each with distinct failure modes. County deed and title PDFs span 3,600+ recorder offices, each effectively its own document class. Scanned lease addenda break OCR on degraded scans and handwritten marginalia. Offering memoranda are table-heavy, multi-page: a 60-page OM may contain the financial detail that decides an underwriting call buried in a table on page 41. Zoning ordinances are long-form and jurisdiction-specific. Building permits are semi-structured municipal forms with field variance across every municipality.
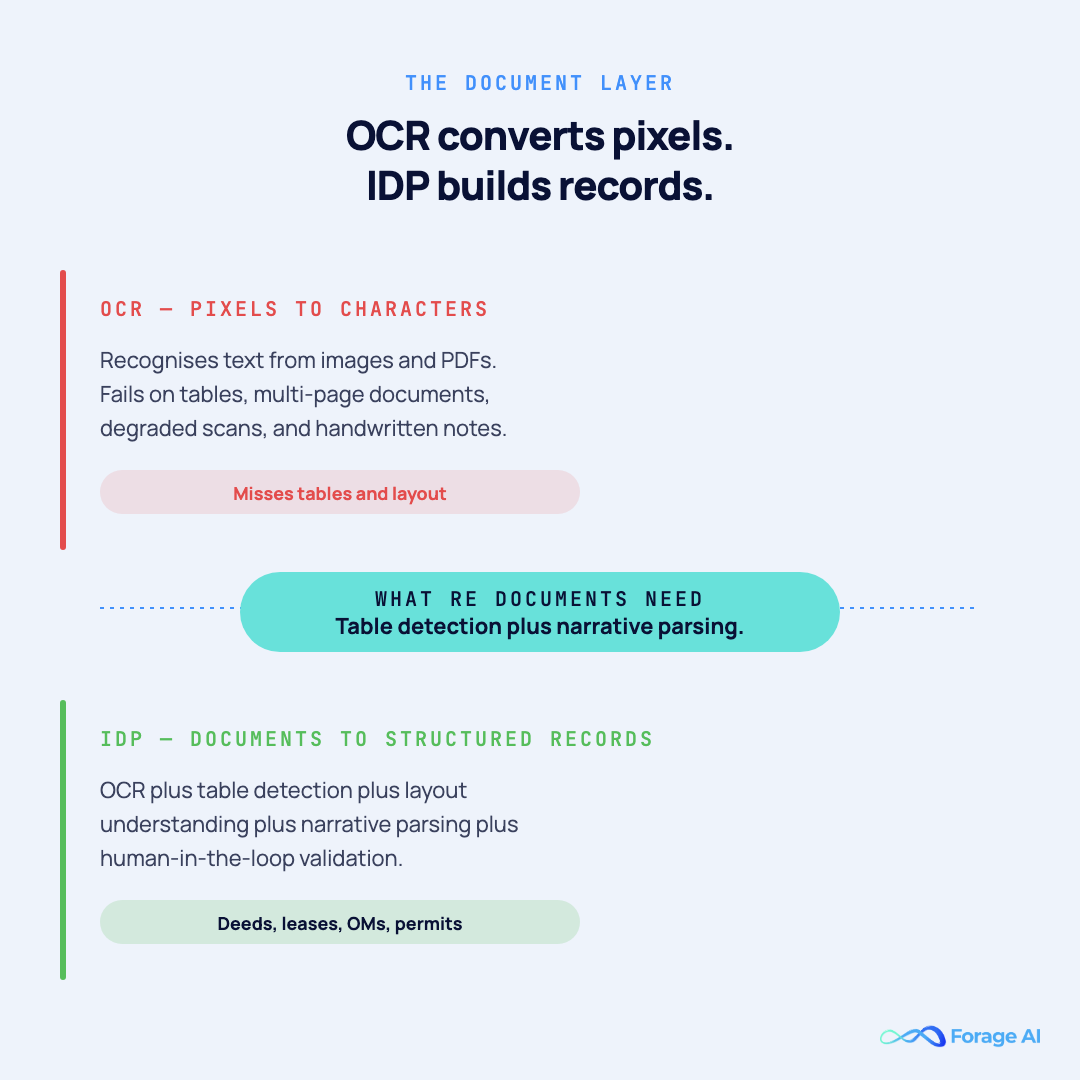
Definition Block — OCR vs. IDP. OCR converts pixels to characters. IDP (intelligent document processing) turns documents into structured records: OCR plus table detection, layout understanding, narrative parsing, and human-in-the-loop validation. OCR alone fails on table-heavy, multi-page, mixed-format RE source documents.
If you only need parcel data, public APIs may cover. For ownership chain, lease terms, or permit history, IDP is the only viable path, tuned per document class, not per state. A longtime CRE-data-platform CEO captured the gap: “There’s a wealth of important data that’s not being incorporated into analysis and modeling because it’s currently unstructured.” OMs and leases are the canonical examples.
Two myths to retire. “LLMs will parse our documents”: LLMs hallucinate on tables, skip pages, silently misalign cells; they consume clean records, they don’t produce them. “One IDP template per state”: county-by-county variance is too wide; the working unit is the document-class template, refined per jurisdiction. See document extraction at scale.
Expert Insight: The teams shipping CRE market intelligence faster than peers are not the ones with the better model. They are the ones whose IDP layer can absorb a new county’s deed format in days, not quarters.
Quick Summary: OCR is enough if your data product never reads documents. The moment it does (deeds, leases, OMs, permits), OCR alone quietly misses 20–40% of the field-level content that matters.
Enrichment and Analytics — Turning Raw Extraction into Market Signal
Enrichment is what happens between raw extraction and the analytics that ships. Three work-streams: schema normalization across counties, states, and portals (RESO Data Dictionary helps, doesn’t solve); entity resolution across sources (matching “ABC LLC” against “ABC Holdings LLC” across deed records, MLS listings, and Secretary of State filings); and geographic and temporal alignment (parcel polygons, address standardization, refresh-time stamping).
Once enriched, three analytics outputs dominate: pricing intelligence (AVMs, comps), market intelligence (DOM, absorption, pricing pressure), and forecasting via leading indicators like Construction-to-Absorption Ratio and Population-Adjusted Job Growth. For the investor-side application, see how RE investors use web data.
Stat Callout — AVM accuracy is data-bound, not model-bound. Zillow’s Zestimate runs at 2.4% median error on-market and ~7.5% off-market (2024). Industry AVM error rates: 5–10%. Same model on better data, better number. Same model on stale data, worse number.
McKinsey’s real estate big-data framing still holds: “stitching such data points together can more accurately predict hyperlocal areas with outsized potential.” The stitching is enrichment. The prediction is analytics. Neither survives a pipeline shipping duplicate parcels or mis-merged LLCs.
Expert Insight: Entity resolution is the single most leveraged investment in a RE analytics stack. Get it wrong and every downstream count (units, listings, transactions, owners) is over- or understated, and you cannot tell which.
Quick Summary: “Better AVM accuracy” is almost always a data problem, not a model problem. Stale, thin, or duplicated comps cap accuracy regardless of model choice.
Build vs Buy vs Partner? An Honest Decision Framework
Three operational paths. Buy pre-built datasets (API options: ATTOM, CoreLogic, HouseCanary). Build in-house extraction (your team owns scraping, anti-bot, schema, QA, and refresh). Partner with a managed provider that owns the pipeline so your team owns the data product. Most Type-1 data-product teams end up hybrid. If you go the pre-built route, it is worth knowing how to evaluate a real estate data API on coverage, freshness, schema, and license terms before you commit.
| Criterion | Buy | Build | Partner |
|---|---|---|---|
| Coverage breadth (parcels, listings) | Strong | Variable | Strong (custom by source) |
| Custom fields, niche geographies | Weak | Strong | Strong |
| Competitor monitoring (price/inventory) | Not offered | Strong if maintained | Strong (change monitoring SLA) |
| Document-derived intelligence (deeds, OMs, leases) | None | Engineering-heavy | Strong (IDP layer) |
| Anti-bot maintenance overhead | None | High and rising | Owned by provider |
| Schema-drift handling | Provider problem | Your problem | Provider problem |
| QA at ingest | Provider’s SLA | Your team builds | Provider’s SLA, often deeper |
| Engineering time-to-market | Days | 6–18 months | 1–2 weeks per new source class |
| Long-run total cost | High recurring | Hidden maintenance dominates | Predictable per-source |
The framework:
- If pre-built breadth covers 100% of your data product, buy is enough. (Rare for any product monetizing differentiated insight.)
- If you need custom fields, niche geographies, granularity beyond pre-built, competitor monitoring, or IDP, buy is not enough.
- If you have ≥10 engineers dedicated to extraction and can absorb maintenance overhead, build can work.
- If extraction is not your differentiator, your team is at capacity, or you need on-call QA SLA, partner.
Two myths drive bad decisions. “We already pay ATTOM, so we’re done”: pre-built is a starting layer, not a full stack. “Build will be cheaper long-term”: true only if total cost includes the QA team, anti-bot ops, schema-drift maintenance, and engineer-month opportunity cost of every new source. Most build-vs-buy spreadsheets undercount the third bucket by 4–6x.
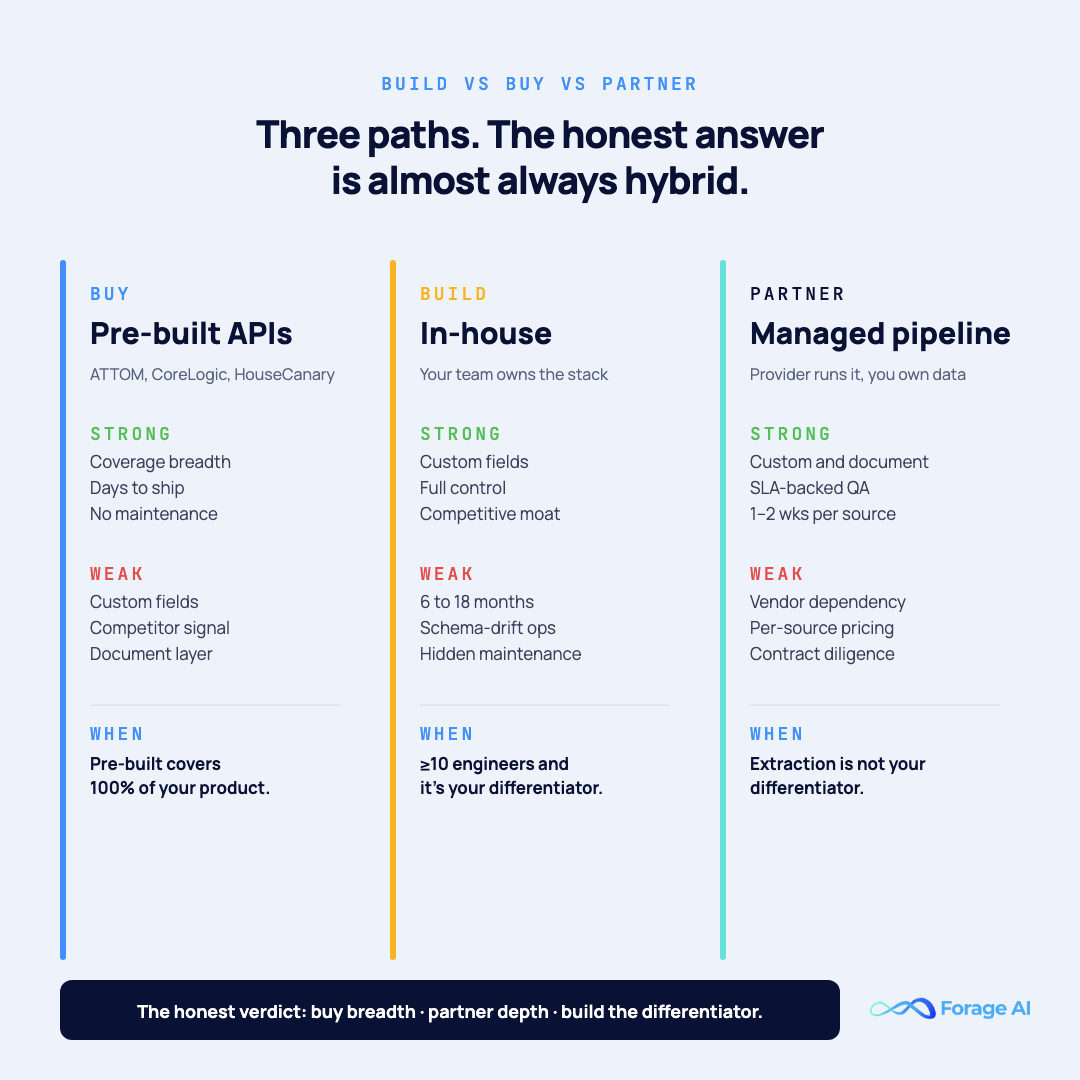
The honest verdict: hybrid. Buy for breadth on stable categories. Partner for the custom, competitor-monitoring, and document layer where pre-built ends and in-house economics break down past source #50.
Expert Insight: The build-vs-buy decision is not a one-time call; it is a quarterly review. Build covers source #1–50 cleanly; partner is where source #51–500 stops being a hiring problem.
Quick Summary: Default to “buy the breadth, partner the depth, build only what is your competitive differentiator.” Building extraction infrastructure that isn’t your differentiator is the most expensive undifferentiated heavy lifting in the stack.
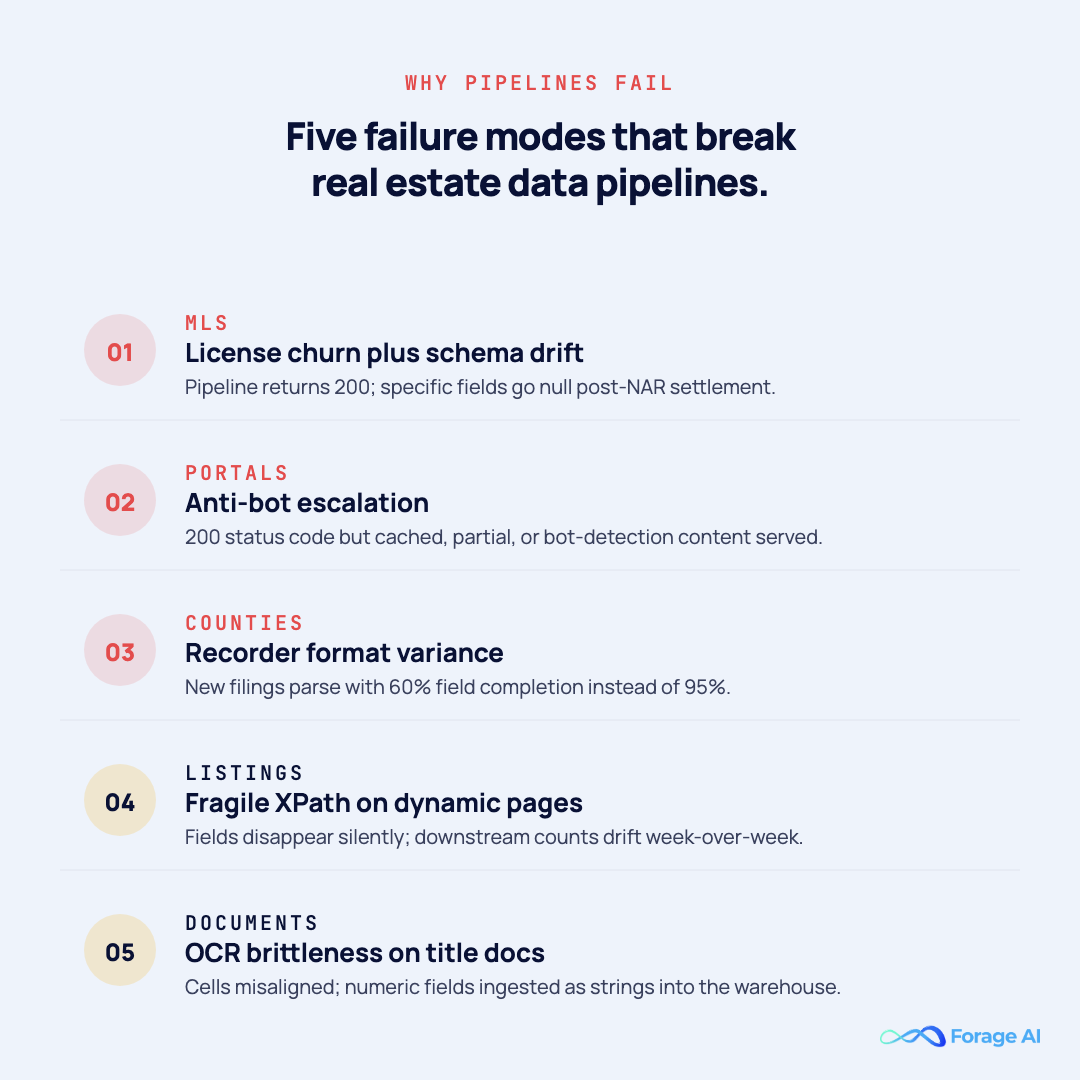
Why Most Real Estate Pipelines Fail — The Operational Realities
Every failure mode below is a real 2024–2026 event. Five patterns account for most production incidents:
| Failure Mode | How It Shows Up | What Stops It |
|---|---|---|
| MLS license churn + schema drift | Pipeline returns 200; specific fields go null post-NAR settlement | Schema-drift detection on every run + alerting + MLS-by-MLS contract tracking |
| Anti-bot escalation on portals | 200 status code but cached / partial / bot-detection content | Browser-context rotation; last-known-good content comparison; multi-method extraction fallback |
| County recorder format variance | New filings parse with 60% field completion instead of 95% | Document-class IDP templates; QA-at-ingest field-completion thresholds |
| Fragile XPath on dynamic listings | Field disappears silently; downstream counts drift | NLP + ML fallback selectors; weekly extraction-version diffing |
| OCR brittleness on title docs | Cells misaligned; numeric fields ingested as strings | Table-detection model + human-in-the-loop validation on high-stakes records |
Silent failures are worse than loud ones. A pipeline returning degraded or garbled data feeds bad analytics into your product. The operational answer is QA-at-ingest, validation at the structural and field-completion levels on every run, plus schema-drift detection and multi-method redundancy. The same discipline underpins how automated web scraping companies build reliable QA workflows across pre-scrape setup, real-time monitoring, and post-scrape validation. If you cannot answer “how do you know your last run was correct?” in one sentence, you have a hope, not a pipeline.
Common-mistake shortlist: one-off scripts called pipelines; no QA at ingest; XPath-only extraction with no NLP/ML fallback; no on-fail alerting beyond HTTP status; no audit or lineage trail; “we’ll fix it when it breaks” (it already broke; you just don’t know when).
Licensing fragility compounds the technical layer. The HouseCanary–Google IDX policy debate (HousingWire, Oct–Dec 2025) and the CRMLS lawsuit against Homes.com/CoStar (Inman, Oct 2025) demonstrate that MLS-data licensing is actively litigated, not settled.
Expert Insight: In our review of production RE pipelines, silent extraction degradation accounts for more downstream data-quality incidents than hard crashes by a wide margin. Crashes get paged. Silent drift gets shipped to customers.
Quick Summary: The single change that cuts the most failure surface is QA at ingest with field-completion thresholds and last-known-good comparison. Not new selectors. Validation before the data hits the warehouse.
Compliance and the Regulatory Landscape You Cannot Ignore
Compliance is now a data-team problem, not just a legal-team problem. Three landmark events in 18 months changed what RE analytics teams can do with their pipelines.
NAR Settlement (Mar 15, 2024, $418M, effective Aug 17, 2024) required MLSs to eliminate broker compensation fields and banned filtering on compensation. Operational consequence: schema-level break in every MLS feed, aftermath rolling through 2026.
HUD Fair Housing Act AI Guidance (May 2, 2024) clarified the FHA applies to algorithmic tenant screening and housing advertising even when AI performs the function. Bad data on credit, eviction, and criminal records can produce disparate-impact discrimination, making upstream data sources a compliance surface.
DOJ v. RealPage (Nov 24, 2025) established the first federal algorithmic-pricing precedent. RealPage must stop using competitively sensitive nonpublic data shared among landlords; model training limited to historical data 12+ months old; three-year monitor.
Conditional logic:
- If your pipeline feeds tenant screening or ad targeting, the HUD scope applies; document the data sources and refresh cadence.
- If you pool competitor rent data for pricing recommendations, the DOJ-RealPage precedent applies; audit what trains your models and when they were collected.
- If you depend on MLS feeds, IDX policy is actively litigated; contract terms shift mid-year.
CFAA risk is low post-hiQ v. LinkedIn. Contract liability on the portal TOS is real. The bigger 2026 risk is not CFAA; it is feeding a model that triggers FHA or Sherman Act exposure downstream.
This article provides general guidance, not legal or compliance advice. Consult qualified counsel for your organization’s specific requirements.
Expert Insight: The compliance layer is a data-architecture problem you encode in lineage: every record traceable to source, timestamp, and licensing context, because that’s the only artifact that survives a regulator’s question.
Quick Summary: The center of gravity moved from “is scraping legal” to “is the data we trained on legal to use this way.” Pipeline architecture is now the compliance artifact.
How Property Teams Operationalize This with Forage AI
For property teams that pick the partner path (per the framework above), the working shape with Forage AI: Custom Web Data Extraction owns listing portals, county recorders, municipal portals, and competitor websites; Intelligent Document Processing owns deeds, titles, leases, OMs, and permits at multi-county scale; Website Change Monitoring owns sub-hour competitor pricing and inventory signal; Entity Matching + RAG-ready delivery resolves “ABC LLC” against “ABC Holdings LLC” across deeds, MLS listings, and Secretary of State registries.
Working with Forage AI. If your team is at the long-tail wall (sources 51 to 500 are breaking what worked for sources 1 to 50), let’s talk. Forage builds and runs custom RE data pipelines across listings, transactions, deeds, leases, permits, and competitor monitoring at the scale where in-house extraction stops scaling. Full data ownership (we never resell), on-prem options for sensitive data, SLA-backed delivery, and a QA team three times the industry average. You own the data, forever. We run the pipeline, forever. Talk to our expert.
FAQ
What is real estate data analytics?
The analytical output of an operational data pipeline: sources → extraction → enrichment → analytics → action. The SaaS dashboard is the rendering layer; analytics quality is bounded by what those upstream stages produce. For the foundational primer, see real estate data fundamentals.
How fresh does real estate data need to be?
Depends on intent. Competitor pricing wants sub-hour. New listings sub-day. Tax assessment quarterly. Zoning on-change. Over-fresh wastes compute; under-fresh feeds wrong analytics. Map cadence to the downstream decision, not “as fresh as possible.”
API provider vs custom extraction — which one when?
Pre-built APIs (ATTOM, CoreLogic, HouseCanary) for breadth on stable categories. Custom extraction when you need niche fields, competitor monitoring, granularity beyond pre-built, or document-derived data. Partner, when building economics don’t work, typically past source #50. Most production stacks are hybrid.
How do I automate market intelligence without a 10-person engineering team?
Run the build-vs-buy-vs-partner framework honestly. If extraction is not your competitive differentiator, partner. If your engineering team is at capacity, partner. Build only what is genuinely your differentiator.
Conclusion
The MLS count is below 500 for the first time. The aftermath of the NAR settlement is still rolling. DOJ-RealPage established the first federal algorithmic-pricing precedent. The 2026 RE data operations environment is more fragmented, more litigious, and more AI-dependent than in 2024. Pipelines that worked in 2024 are quietly breaking in production right now.
If you can name what is happening at each of the five stages on your platform today (sources, extraction, enrichment, analytics, action) you have a pipeline. If you can’t, you have a dashboard sitting on unowned plumbing. That’s the single check worth running before the next quarter starts.
Three paths: buy, build, partner. The honest answer for most Type-1 data-product teams is hybrid: buy for breadth in stable categories, partner for the custom, competitor-monitoring, and document layer where pre-built solutions end. The 5% of RE companies that achieved their AI goals didn’t do so with the model. They got there with the data layer beneath it.
Related Articles
- The Best Real Estate Data Providers 2026 — Provider-by-provider comparison across coverage, customization, and delivery models.
- 5 AI Technologies Transforming Real Estate Data in 2025 — The AI overlay on the enrichment and analytics layer.