
US Foreclosure Rates 2026: By State, by Year and Why the Numbers Differ
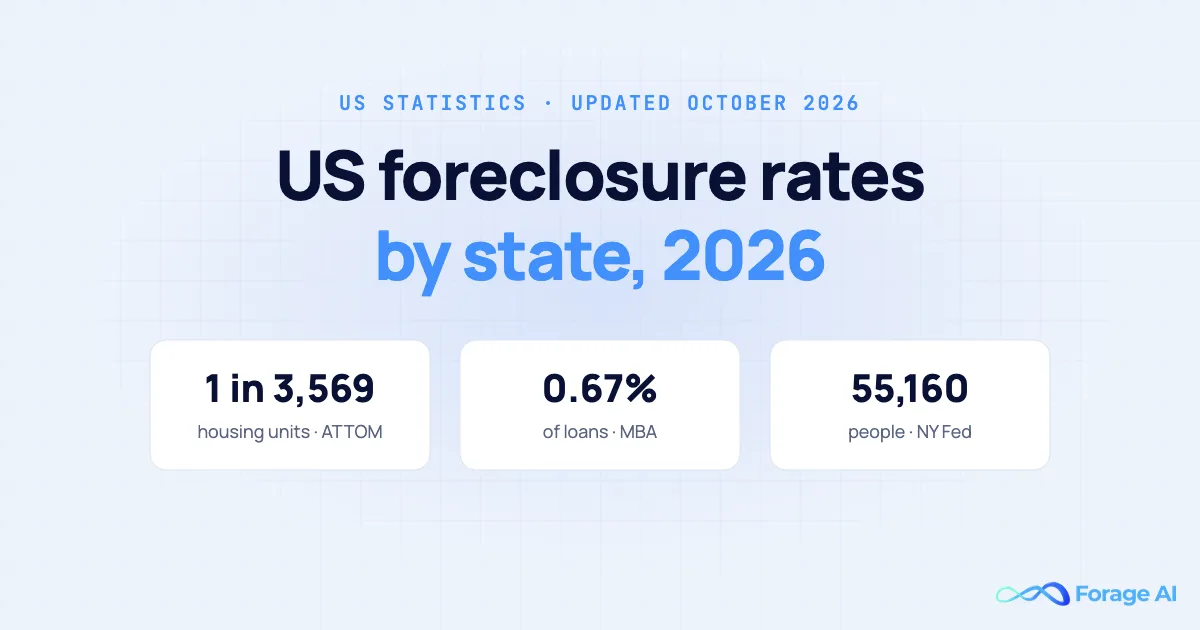
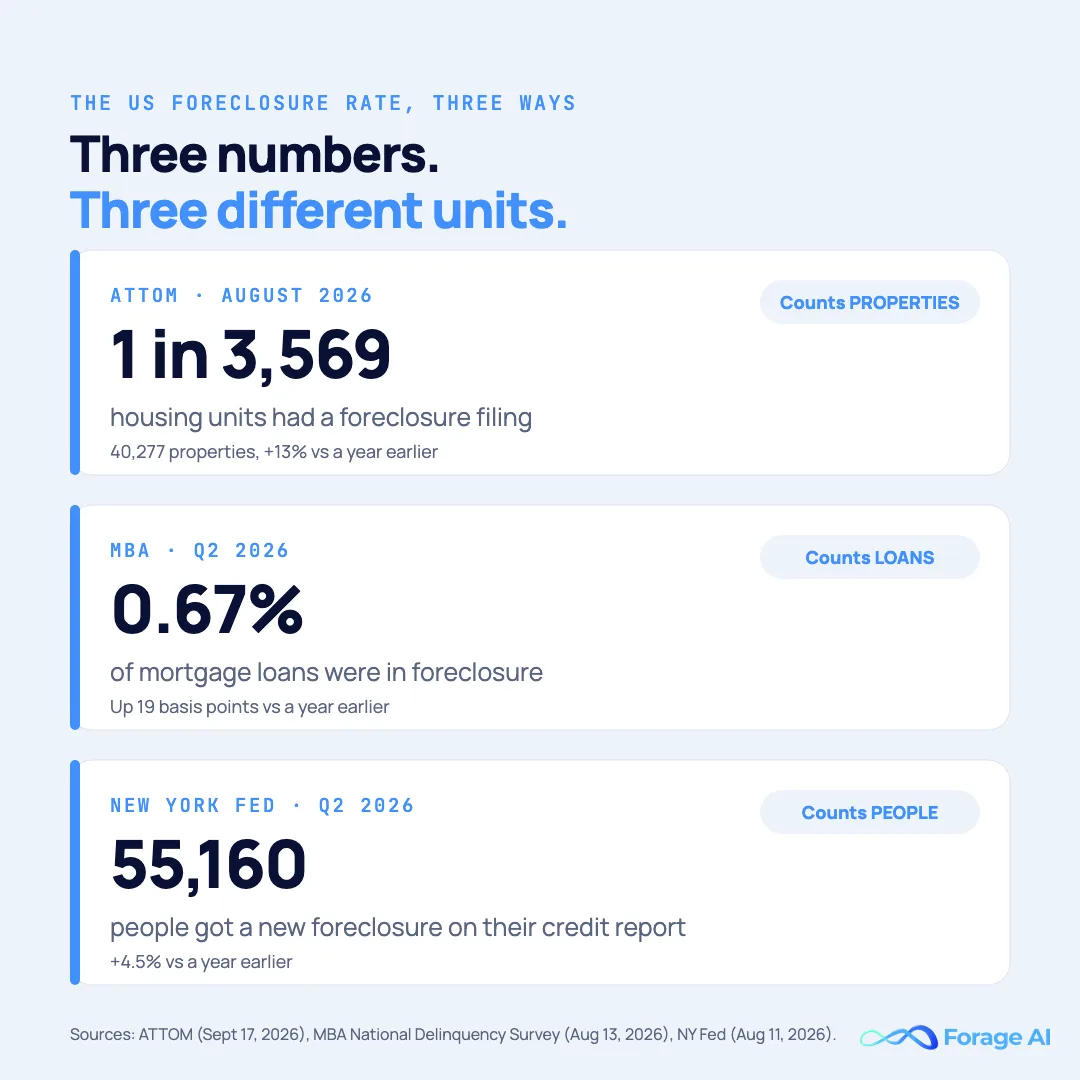
Ask three trusted sources for the US foreclosure rate this autumn and you get three answers: 1 in 3,569 housing units, 0.67% of mortgages, and about 55,000 people. None of them is wrong.
They count different things. One counts properties with a filing, one counts loans in the foreclosure process, and one counts people with a new foreclosure on their credit report. In practice, the number you quote decides whether foreclosures look like they are surging or barely moving.
This page puts the official measures side by side, rebuilds a 50-state table from free government data, and explains why the state rankings disagree. We update it after each major release.
- The answer: 1 in 3,569 US housing units had a foreclosure filing in August 2026, and 0.67% of mortgages were in foreclosure at the end of the second quarter.
- The direction: up on a year ago on every major measure, and far below the crisis. New foreclosures on credit reports are about 90% under their 2009 peak.
- The states: South Carolina and Nevada top the monthly filing list, while Louisiana and Kentucky top the government's loan data. The measure decides the ranking.
- The pattern: states that foreclose through the courts hold about 1.75 times the foreclosure inventory of other states, with the same rate of serious delinquency.
What is the current US foreclosure rate?
The current US foreclosure rate is 1 in 3,569 housing units with a filing in August 2026, according to ATTOM, or 0.67% of mortgage loans in foreclosure at the end of the second quarter, according to the Mortgage Bankers Association. Both are up on a year ago. Neither is close to the 2009 and 2010 crisis.
Here is every major measure we track, in the unit each one actually uses.
| Source | Latest figure | What it counts | Period | Change vs a year earlier |
|---|---|---|---|---|
| ATTOM | 1 in 3,569 housing units (40,277 properties) | Properties with a default notice, auction notice or bank repossession | August 2026 | +13% in properties with filings |
| Mortgage Bankers Association | 0.67% of loans in foreclosure; starts at 0.20% | One-to-four-unit mortgage loans reported by servicers | Q2 2026 | +19 basis points in foreclosure inventory |
| New York Fed | 55,160 people (0.019% of consumers) | People with a new foreclosure notation on their credit report | Q2 2026 | +4.5% |
| FHFA National Mortgage Database | 0.2% of mortgages | Mortgages in foreclosure, bankruptcy or deed-in-lieu (a 5% sample) | Q2 2026 | Up from 0.1% |
| ICE | 0.54% of loans (298,000); 37,000 starts | Active loans in the foreclosure process | August 2026 | +41% in inventory; +28.8% in starts |
Are foreclosures up? Yes, on every measure in that table. The size of the rise is where they part ways. ICE shows starts up almost 29% on a year ago, while the MBA's quarterly starts rate actually fell 4 basis points from the first quarter to 0.20%. Both can be true, because one is a monthly count of loans and the other is a share of a much larger base.
"Mortgage delinquencies decreased slightly across all loan types in the second quarter of 2026. Nonetheless, the broader trend is that both delinquencies and foreclosures have increased over the past year."
Marina Walsh, Vice President of Industry Analysis, Mortgage Bankers Association, August 13, 2026
US foreclosure rates by state: three measures side by side
Most state rankings online repeat one vendor's monthly list. We built ours from the one free source that covers every state: the National Mortgage Database run by the Federal Housing Finance Agency and the CFPB, which publishes the share of mortgages in foreclosure and the share 90 or more days late, by state, every quarter. You can find the series on FHFA's aggregate statistics page.
Two more columns sit beside it. The New York Fed publishes its new-foreclosure rate for only 11 states, and ATTOM's August release names its top ten and bottom five. We show those where they exist rather than fill the gaps with guesses.
Two things stand out before you scan the table. Serious delinquency rose in 48 of 51 jurisdictions over the year, from 0.8% to 1.0% of mortgages nationally. The fastest risers were Rhode Island (0.7% to 1.4%), Georgia (1.0% to 1.6%), Maryland (0.9% to 1.4%) and Mississippi (1.3% to 1.8%).
| State | Foreclosure process | In foreclosure, % of mortgages (Q2 2026) | 90+ days late, % of mortgages (Q2 2026) | 90+ change vs Q2 2025 (points) | New foreclosures, % of consumers (NY Fed, Q2 2026) | ATTOM filing rate (Aug 2026) |
|---|---|---|---|---|---|---|
| Louisiana | Judicial | 0.5% | 2.1% | +0.4 | Not published | Not named |
| Kentucky | Judicial | 0.5% | 1.0% | +0.2 | Not published | Not named |
| Mississippi | Non-judicial | 0.4% | 1.8% | +0.5 | Not published | Not named |
| Oklahoma | Judicial | 0.4% | 1.3% | +0.4 | Not published | Not named |
| Arkansas | Non-judicial | 0.4% | 1.2% | +0.3 | Not published | Not named |
| West Virginia | Non-judicial | 0.4% | 1.1% | +0.1 | Not published | Not named |
| Florida | Judicial | 0.3% | 1.4% | +0.4 | 0.026% | 1 in 2,397 |
| Alabama | Non-judicial | 0.3% | 1.2% | +0.3 | Not published | 1 in 3,016 |
| District of Columbia | Judicial | 0.3% | 1.2% | +0.1 | Not published | Not named |
| Illinois | Judicial | 0.3% | 1.2% | +0.2 | 0.025% | 1 in 2,880 |
| South Carolina | Judicial | 0.3% | 1.2% | +0.2 | Not published | 1 in 1,547 |
| Indiana | Judicial | 0.3% | 1.1% | +0.2 | Not published | 1 in 2,535 |
| Ohio | Judicial | 0.3% | 1.1% | +0.3 | 0.021% | Not named |
| Pennsylvania | Judicial | 0.3% | 1.1% | +0.2 | 0.023% | Not named |
| New Mexico | Judicial | 0.3% | 1.0% | +0.2 | Not published | Not named |
| New York | Judicial | 0.3% | 1.0% | +0.1 | 0.015% | Not named |
| Maine | Judicial | 0.3% | 0.7% | -0.1 | Not published | Not named |
| Vermont | Judicial | 0.3% | 0.7% | 0.0 | Not published | 1 in 67,808 |
| Hawaii | Judicial | 0.3% | 0.6% | -0.1 | Not published | Not named |
| Maryland | Non-judicial | 0.2% | 1.4% | +0.5 | Not published | 1 in 2,530 |
| Texas | Non-judicial | 0.2% | 1.3% | +0.3 | 0.022% | 1 in 2,445 |
| Connecticut | Judicial | 0.2% | 1.1% | +0.3 | Not published | Not named |
| Delaware | Judicial | 0.2% | 1.1% | +0.1 | Not published | 1 in 2,796 |
| Kansas | Judicial | 0.2% | 1.0% | +0.3 | Not published | 1 in 13,910 |
| New Jersey | Judicial | 0.2% | 1.0% | +0.2 | 0.021% | Not named |
| North Carolina | Non-judicial | 0.2% | 1.0% | +0.2 | Not published | Not named |
| Tennessee | Non-judicial | 0.2% | 1.0% | +0.3 | Not published | Not named |
| Iowa | Judicial | 0.2% | 0.9% | +0.2 | Not published | Not named |
| Georgia | Non-judicial | 0.1% | 1.6% | +0.6 | Not published | Not named |
| Rhode Island | Non-judicial | 0.1% | 1.4% | +0.7 | Not published | 1 in 14,725 |
| Arizona | Non-judicial | 0.1% | 1.0% | +0.4 | 0.025% | Not named |
| Missouri | Non-judicial | 0.1% | 1.0% | +0.3 | Not published | Not named |
| Nevada | Non-judicial | 0.1% | 1.0% | +0.2 | 0.016% | 1 in 1,920 |
| Utah | Non-judicial | 0.1% | 1.0% | +0.4 | Not published | 1 in 2,920 |
| Alaska | Non-judicial | 0.1% | 0.9% | +0.3 | Not published | Not named |
| Michigan | Non-judicial | 0.1% | 0.9% | +0.2 | 0.020% | Not named |
| North Dakota | Judicial | 0.1% | 0.9% | +0.1 | Not published | Not named |
| Virginia | Non-judicial | 0.1% | 0.9% | +0.3 | Not published | Not named |
| Wyoming | Non-judicial | 0.1% | 0.9% | +0.3 | Not published | Not named |
| Colorado | Non-judicial | 0.1% | 0.8% | +0.2 | Not published | Not named |
| Nebraska | Non-judicial | 0.1% | 0.8% | +0.3 | Not published | Not named |
| Massachusetts | Judicial | 0.1% | 0.7% | +0.2 | Not published | Not named |
| Minnesota | Non-judicial | 0.1% | 0.7% | +0.1 | Not published | Not named |
| Montana | Non-judicial | 0.1% | 0.7% | +0.1 | Not published | Not named |
| Oregon | Non-judicial | 0.1% | 0.7% | +0.2 | Not published | Not named |
| South Dakota | Judicial | 0.1% | 0.7% | +0.2 | Not published | 1 in 21,322 |
| California | Non-judicial | 0.1% | 0.6% | +0.1 | 0.011% | Not named |
| New Hampshire | Non-judicial | 0.1% | 0.6% | +0.1 | Not published | Not named |
| Washington | Non-judicial | 0.1% | 0.6% | +0.1 | Not published | Not named |
| Wisconsin | Judicial | 0.1% | 0.5% | +0.1 | Not published | 1 in 11,204 |
| Idaho | Non-judicial | 0.0% | 0.7% | +0.2 | Not published | Not named |
Download the state table (CSV), with Fannie Mae's maximum allowed foreclosure timeline for each state included. Two cautions apply to it. The FHFA foreclosure share is rounded to one decimal place, so many states tie, which is why we show values and not ranks. It also comes from a 5% sample of mortgages, so treat a 0.1-point gap between two states as noise.
Which state has the highest foreclosure rate?
It depends on which measure you ask, and on which month. ATTOM's monthly list changes its leader often: Nevada led in July 2026, South Carolina in August, and Florida led the first half of the year as a whole. The loan-based measures point somewhere else again.
| Measure | Period | Highest state | Value |
|---|---|---|---|
| ATTOM filings per housing unit | August 2026 | South Carolina | 1 in 1,547 housing units |
| ATTOM filings per housing unit | First half of 2026 | Florida | 1 in 373 housing units |
| FHFA share of mortgages in foreclosure | Q2 2026 | Kentucky and Louisiana (tied) | 0.5% |
| FHFA share of mortgages 90+ days late | Q2 2026 | Louisiana | 2.1% |
| New York Fed share of consumers with a new foreclosure | Q2 2026 | Florida (of the 11 states published) | 0.026% |
Nevada is the clearest case of the measures disagreeing. It ranks second on ATTOM's August list at 1 in 1,920 housing units. On the government data it looks ordinary: 0.1% of mortgages in foreclosure, 1.0% seriously delinquent, and a New York Fed new-foreclosure rate of 0.016%, below the national 0.019%. We have not found a published explanation for the gap, and we are not going to invent one. What we can say is that a filing count per housing unit and a share of active mortgages are answering different questions, and Nevada sits where those questions diverge.
Louisiana is the opposite case. It tops the loan data on both delinquency and foreclosure inventory, yet ATTOM's monthly list does not put it in the top ten. Its average foreclosure in ATTOM's second-quarter data took 3,491 days, the longest in the country, so distressed loans pile up in inventory long before they generate new filings.

Why do foreclosure numbers differ between ATTOM, MBA and the Fed?
The Congressional Research Service put it plainly in its guide to foreclosure statistics: the sources "differ in their methodologies, definitions of terms, and the types of loans they describe." In our reading of the current releases, four differences do most of the work.
Different units. ATTOM counts properties, the MBA, ICE and FHFA count loans, and the New York Fed counts people. The New York Fed says so in its own report, noting that its measure "is conceptually different from foreclosure rates often reported in the press," because one borrower can hold several mortgages. Its report is on the New York Fed's Household Debt and Credit page.
Different denominators. ATTOM divides by all housing units, including rentals and homes with no mortgage at all. The loan-based sources divide by active mortgages. The same 40,000 filings look much smaller against every home in the country than against the homes that actually carry a loan.
Flow versus stock. A filing or a start is an event in a month, while foreclosure inventory is a stock at a point in time. ICE counted 37,000 starts in August and ATTOM counted 25,894. ICE works from servicer loan records and ATTOM from county documents entered into its database, so even two counts of the same event differ.
Different coverage. The MBA surveys servicers covering tens of millions of loans. The New York Fed and the FHFA database each work from a 5% sample. ATTOM collects from more than 3,000 counties holding over 99% of the US population. Each one sees a slightly different slice of the market.
| If your question is | Use | Why |
|---|---|---|
| Is mortgage distress rising? | MBA or ICE delinquency and inventory | Loan-level, timely, and they show the pipeline before filings appear |
| Where are auctions and repossessions coming? | ATTOM filings, or county records directly | Built from recorded documents, down to metros and counties |
| How many households are affected? | New York Fed | Counts people, not loans or properties |
| How do all 50 states compare, for free? | FHFA National Mortgage Database | The only free, government, every-state foreclosure series |
Numbers we do not repeat
- "Foreclosures up 21%": that is the rise in properties with any filing in the first half of 2026, not completed foreclosures.
- "2.9 million foreclosures in 2010": about 2.87 million properties had a filing that year. Bank repossessions peaked near 1.05 million.
- "FHA foreclosure rate of 11.79%": that is the MBA's FHA delinquency rate, not a foreclosure rate.
How judicial and non-judicial foreclosure changes state rankings
Every state starts from the same federal floor. Under Regulation X, a servicer cannot make the first notice or filing for foreclosure until a borrower is more than 120 days behind. What happens next depends on state law. The biggest split is whether the lender must go through a court.
Fannie Mae's servicing guide lists 23 states and the District of Columbia where the preferred method is judicial, and 27 states where it is not. When we grouped the FHFA state data that way, the pattern was clear.
| Group | Jurisdictions | Average share of mortgages in foreclosure | Average share 90+ days late | Foreclosure inventory per point of serious delinquency |
|---|---|---|---|---|
| Judicial (court process) | 24 | 0.27% | 1.02% | 0.26 |
| Non-judicial | 27 | 0.15% | 0.99% | 0.15 |
Court-process states carry about 1.76 times the foreclosure inventory of other states, while their serious delinquency rate is essentially the same. In practice that means distressed loans are not more common there. They simply stay in the process longer, which pushes court-process states up any ranking built on inventory and down any ranking built on new filings.
Timelines show the same thing from the other side. ATTOM's average time to complete a foreclosure fell to 563 days in the second quarter of 2026, the shortest since 2013. The state averages range from 155 days in Texas, 157 in New Hampshire and 173 in Wyoming to 2,007 in New York, 2,293 in Hawaii and 3,491 in Louisiana. Fast states convert distress into repossessions quickly: Texas alone accounted for 1,835 of the 5,794 bank repossessions in August, close to a third of the national total.
One caution on those averages. Fannie Mae's maximum allowed timeline for Louisiana is 540 days, far below ATTOM's 3,491-day average. The average includes very old cases that finally closed, so a handful of decade-long files can drag a state's figure well past its legal norm. Read the timeline averages as a backlog signal, not a typical case.
US foreclosure rate chart by year, 1999 to 2026
The longest consistent series is the New York Fed's count of people with a new foreclosure on their credit report, which runs quarterly back to 1999. It uses one unit throughout, so the shape is honest.
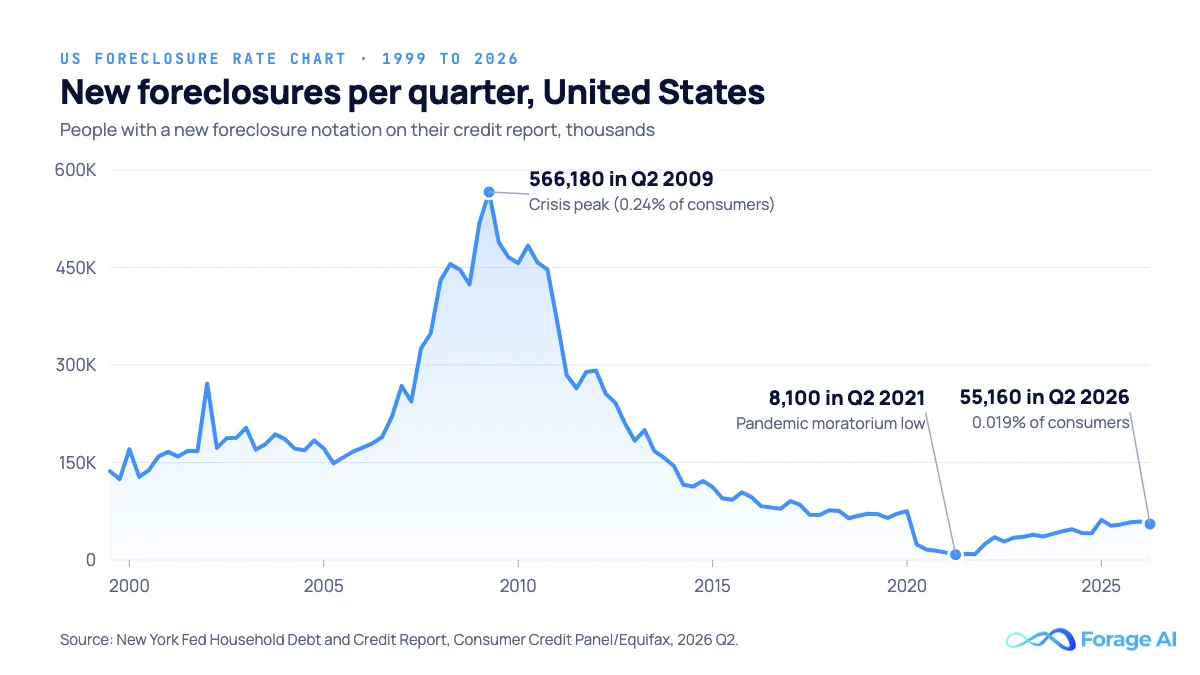
Three points carry the story. The crisis peak was 566,180 people in the second quarter of 2009, or 0.24% of consumers. The low was 8,100 in the second quarter of 2021, when federal moratoriums paused most foreclosures. The latest reading is 55,160, up 4.5% on a year ago but still 23% below the end of 2019 and about 90% below the peak.
ATTOM's annual property counts tell the same story in a different unit.
| Year | Properties with a foreclosure filing (ATTOM) | What it marks |
|---|---|---|
| 2010 | About 2.87 million | Record year; bank repossessions peaked near 1.05 million |
| 2019 | About 490,000 (2025 was 25% below it) | Pre-pandemic baseline |
| 2021 | 151,153 | Lowest since ATTOM's tracking began in 2005 |
| 2025 | 367,460 (1 in 385 housing units) | Up 14% on 2024, down 87% from 2010 |
| First half of 2026 | 227,548 (1 in 632 housing units) | Up 21% on the first half of 2025 |
FHA and VA loans: where mortgage stress is rising fastest
The national averages hide where the strain sits. Government-backed loans, which serve more first-time and lower-income buyers, are carrying far more of it than conventional loans.
| Loan type | Delinquency rate, Q2 2026 (MBA) | Change vs Q2 2025 | Serious delinquency (FHFA, Q2 2026) |
|---|---|---|---|
| FHA | 11.79% | +122 basis points; serious delinquency +227 basis points | 6.07% |
| VA | 4.89% | +57 basis points | 2.62% |
| Conventional | 2.72% | +12 basis points | 0.59% (Fannie Mae and Freddie Mac loans) |
FHA serious delinquency is roughly ten times the rate on Fannie Mae and Freddie Mac loans. New York Fed researchers found the same tilt by geography in February 2026: the rise in mortgage delinquency was most pronounced among borrowers in lower-income zip codes. If foreclosure starts keep climbing into 2027, we would expect them to come from here first. It is the segment to watch in each new release.
Methodology, sources and update schedule
Every number on this page comes from a published primary source, and the state table is rebuilt from raw files rather than copied from a ranking.
- Sources: ATTOM, MBA and ICE public releases for national figures; the FHFA/CFPB National Mortgage Database for the 50-state table; the New York Fed Household Debt and Credit Report for the 11-state column and the history chart; Fannie Mae's servicing guide for process and timelines.
- What we did not do: we did not reproduce ATTOM's full state table or the MBA's paid state data. Only states named in ATTOM's public release appear in that column.
- Rounding: FHFA publishes to one decimal place, so we show values, not ranks.
- Checks: spot values in the state table were checked against the source files on October 8, 2026.
| Source | Cadence | Next release expected |
|---|---|---|
| ATTOM U.S. Foreclosure Market Report | Monthly, about three weeks after month end | September 2026 data in mid-October 2026 |
| ICE First Look | Monthly, about four weeks after month end | September 2026 data in late October 2026 |
| New York Fed Household Debt and Credit | Quarterly, about six weeks after quarter end | Q3 2026 in early November 2026 |
| MBA National Delinquency Survey | Quarterly, about six weeks after quarter end | Q3 2026 in mid-November 2026 |
| FHFA National Mortgage Database | Quarterly, about three months after quarter end | Q3 2026 around the end of December 2026 |
If your work needs more than state averages, the free data runs out quickly. None of these sources publishes foreclosure filings by county for free. That level of detail lives in thousands of county recorder offices and court dockets, each with its own format and update rhythm. Teams that need it either license it from a vendor or collect it from the counties they care about, and the second route only works if someone owns the upkeep when those sites change.

Verdict: what is the US foreclosure rate in 2026?
The US foreclosure rate in 2026 is rising from a low base: 1 in 3,569 housing units had a filing in August, 0.67% of mortgages were in foreclosure at mid-year, and about 55,000 people a quarter are getting a new foreclosure on their credit report.
- Direction: up on a year ago on every major measure, and about 90% below the 2009 peak.
- Where: South Carolina, Nevada and Florida top the filing counts; Louisiana and Kentucky top the loan data.
- Why rankings differ: the sources count properties, loans and people, and court-process states hold distressed loans longer.
- What to watch: FHA loans, where serious delinquency rose 227 basis points in a year.
Pick the measure that matches your question, and quote its unit with it.
Frequently asked questions
What counts as a foreclosure filing?
In ATTOM's data, a filing is any of three documents recorded against a property: a default notice (such as a notice of default or lis pendens), an auction notice, or a bank repossession. Each property is counted once per period, so a filing is not the same as a completed foreclosure.
How long does a foreclosure take in the US?
Properties that completed foreclosure in the second quarter of 2026 had been in the process for 563 days on average, according to ATTOM. The range is wide: about 155 days in Texas, and more than 2,000 in New York and Hawaii.
What is the difference between pre-foreclosure and foreclosure?
Pre-foreclosure is the period after a lender files a default notice and before the property is sold at auction or repossessed. The borrower can still catch up, sell or agree an alternative during it. Foreclosure is complete once the property is sold or taken back by the lender.
Where can I get foreclosure data by county?
No free federal source publishes foreclosure filings by county. County data comes from recorder offices and court dockets, either collected directly or licensed from a commercial provider. The free FHFA database stops at metro areas.
Related articles
- How Real Estate Investors Use Web Data: where public property data fits in an investment workflow.
- The Best Real Estate Data Providers in 2026: when licensing property data beats collecting it.
- Real Estate Data APIs: how teams pull property data into their own systems.
- Real Estate Data Analytics: turning property records into decisions.
Sai is a data infrastructure enthusiast who has spent the past two to three years following the AI space closely, from the infrastructure layer to the fast-growing world of data for AI. He is genuinely curious about how modern data pipelines get built and where the data industry is heading, and he writes insightful pieces on the core topics that shape this niche.