
B2B Data Decay Statistics: How Fast Records Go Stale (2026)
Data as of 17 September 2026. Every figure below was computed from US government releases: Census Bureau job-to-job flows through the end of 2024, Census business closures through 2023, BLS job turnover through July 2026 and SEC EDGAR filings. No decay rate on this page is taken from a data vendor.
Almost every article about B2B data decay quotes the same numbers: 2.1% a month, 22.5% a year, 30% a year. Trace them back and the trail goes cold. The most-cited figure credits a MarketingSherpa study that nobody links to, and we could not find a published sample or method behind any of them.
So we went and measured it from records anyone can check. Start with the event that does the damage. When a contact leaves their employer, their title, direct dial, work email and company size all go wrong on the same day, and the US Census Bureau tracks that event for most of the country's workers through state unemployment insurance records. Company closures, office closures, leadership changes and renames leave public traces too. Put them together and decay stops being one number. It becomes a different clock for each field, each industry, each state and each kind of company, which is the part a refresh schedule has to respect.
Quick Digest
- The measured rate: 24.8% of stable jobs held by workers with a bachelor's degree ended within 12 months in 2024. Across all workers it was 30.5%.
- The spread: contact data in utilities went stale at 12.7% a year, in accommodation and food services at 48.3%. One average hides a nearly fourfold gap.
- The half-life: half of a list of degree-holding contacts will have left the employer on file within about 2.4 years.
- The company side: 9.5% of US employer firms closed in 2023, the highest rate since 2009, but those firms held only 2.0% of jobs.
- The 2026 direction: quits from January to July 2026 were the lowest for that period since 2015, so contact data is going stale more slowly this year.
Where do the popular decay figures come from?
We traced each widely repeated figure back as far as the public record goes. The table shows where each one is usually credited, the earliest source we could actually find, and whether anyone published how it was measured.
| Figure | Usually credited to | Earliest source we found | Method published? |
|---|---|---|---|
| 2.1% a month, 22.5% a year | MarketingSherpa, via HubSpot | HubSpot's Database Decay Simulation page credits “Marketing Sherpa's research” with no title, year or link. The wording was already live in 2016. We could not find the original study. | No. 22.5% is simply 2.1% compounded over 12 months. |
| 30% a year | Gartner, Harvard Business Review, or no one | The earliest appearance we found is a 2016 Informatica blog post that calls 30% the most conservative estimate and gives no source. | No |
| 70.3% a year | Gartner | Recent citations lead to a general Gartner page with no decay figure. An earlier trail leads back to the same 2016 blog post, which says decay can run as high as 70% in high-turnover sectors, again unsourced. | No |
| 70.8% of records change in a year | John M. Coe, B2B marketing consultant | A May 2020 IndustrySelect blog post reporting an informal survey of 1,025 business cards collected at seminars some years earlier. | Partly. It is a convenience sample, and 29.6% of the card holders had changed companies. |
| Email lists lose 22% to 28% a year | ZeroBounce | ZeroBounce's yearly Email List Decay Report. | Partly. It is the share of addresses customers sent in for checking that came back invalid, not a tracked cohort. |
None of these figures is necessarily wrong. The problem is that none of them has a sample and method anyone can check, and the most-cited one is at least ten years old. The closest thing to a measurement is the business-card survey, where 29.6% of people had changed companies within a year. That lands near the government figures below, which is reassuring, but a seminar audience from years ago is not a basis for a 2026 refresh budget.
B2B data decay rates by field
A contact record is not one fact with one lifespan. It is a handful of them, and they go stale at different speeds. The table below gives the best public measurement we could find for each, and says plainly where no public measurement exists, because a gap you know about is easier to plan around than one you have papered over.
| Field | What makes it go stale | Share that changed within a year | Source and year |
|---|---|---|---|
| Employer, title, work email, direct dial | The contact leaves the job | 24.8% for bachelor's degree holders, 30.5% for all workers | Census LEHD Job-to-Job Flows, 2024 |
| Job title at the same employer | Promotion or internal move | Not measured by any public source | None available |
| Chief executive or chief financial officer | Leadership change at a public company | 27.1% of SEC-reporting companies (sampling range 22.9% to 31.5%) | SEC EDGAR Form 8-K filings, 2025 |
| Company is still operating | The firm closes | 9.5% of employer firms, holding 2.0% of jobs | Census Business Dynamics Statistics, 2023 |
| Office or site address | A business location closes | 9.4% of business locations | Census Business Dynamics Statistics, 2023 |
| Legal company name | Rename, often after a merger | 3.6% of SEC-reporting companies | SEC EDGAR filer records, 2025 |
| Head office address | The company moves | At least 6.2% of SEC-reporting companies moved building | SEC EDGAR filing headers, 2025 sample of 499 |
| Contact's home address | A residential move | 11.8% of people moved | Census American Community Survey, 2024 |
If you track one field, track the employer. It pulls the others down with it: title, work email, direct dial, company name, company size and office address all break together the day someone changes jobs. In practice that makes the job-ending rate the floor for the whole record rather than one field's problem, and it is why a validation pass that only bounces emails understates what is actually wrong.
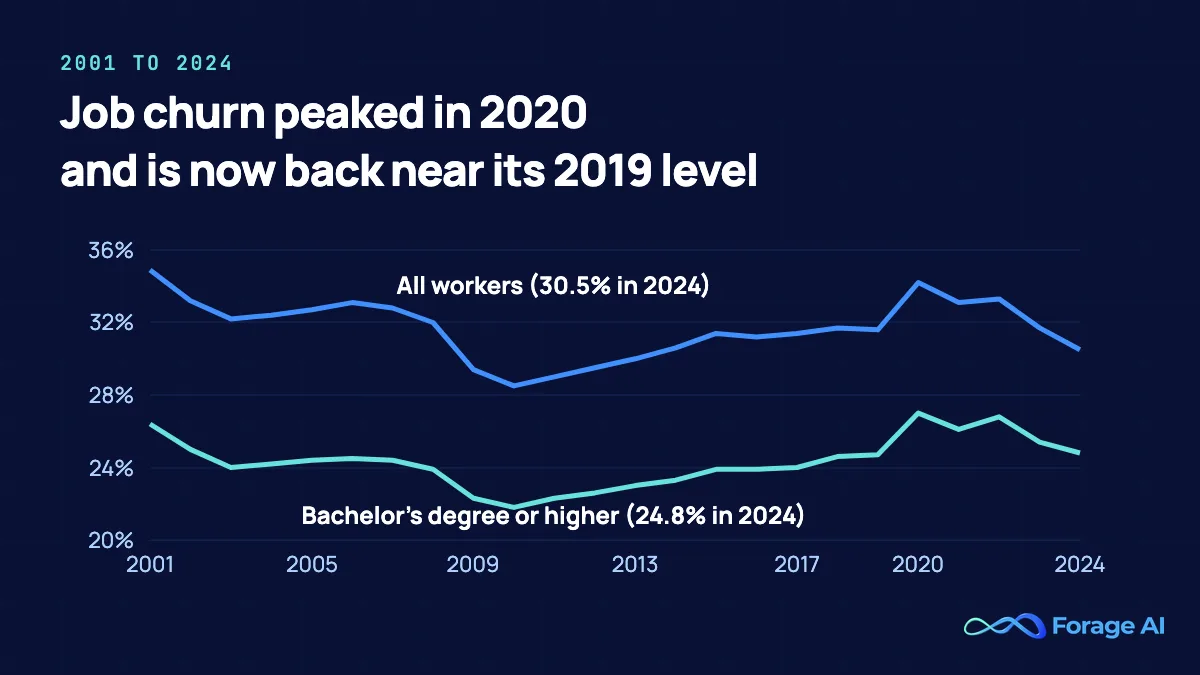
Source US Census Bureau, LEHD Job-to-Job Flows, national file by education
Method Stable jobs are those held for at least a full quarter. We multiplied the share that survived each quarter of 2024 and subtracted the result from one.
So what A list of degree-holding B2B contacts loses about a quarter of its employer accuracy every year, which works out to 2.3% a month. The widely quoted 2.1% a month sits a little below this, but only by accident, and it hides every difference that follows.

Which industries have the fastest data decay?
Here is the cut that should change how you schedule a refresh. Industry moves the rate more than anything else we measured. In 2024, 12.7% of stable jobs in utilities ended within a year, against 19.2% in finance and insurance, 26.2% in professional, scientific and technical services, 26.1% in information and 47.5% in administrative and support services. Accommodation and food services came in at 48.3%.
The half-life column is the one to plan against. It says how long until half of a list has left the employer on file. A finance list gets there in about 3.3 years, so an annual refresh is defensible. A list in administrative and support services, which includes staffing agencies and call centers, gets there in about 1.1 years, and an annual refresh on that list means working a database that is half wrong by the time you finish it.
| Industry | Stable jobs that ended within 12 months (2024) | Contact half-life (years) | Business locations that closed (2023) |
|---|---|---|---|
| Accommodation and food services | 48.3% | 1.0 | 9.1% |
| Administrative and support services | 47.5% | 1.1 | 11.8% |
| Agriculture, forestry and fishing | 45.0% | 1.2 | 11.8% |
| Arts, entertainment and recreation | 43.7% | 1.2 | 10.4% |
| Retail trade | 35.6% | 1.6 | 7.1% |
| Construction | 33.3% | 1.7 | 11.1% |
| Other services | 33.0% | 1.7 | 8.1% |
| Transportation and warehousing | 31.1% | 1.9 | 14.7% |
| Health care and social assistance | 29.7% | 2.0 | 7.7% |
| Real estate | 29.3% | 2.0 | 11.3% |
| Mining, oil and gas | 27.0% | 2.2 | 7.7% |
| Professional, scientific and technical services | 26.2% | 2.3 | 11.0% |
| Information | 26.1% | 2.3 | 11.5% |
| Wholesale trade | 23.1% | 2.6 | 8.2% |
| Manufacturing | 21.9% | 2.8 | 7.0% |
| Educational services | 21.7% | 2.8 | 8.4% |
| Management of companies | 21.5% | 2.9 | 9.5% |
| Finance and insurance | 19.2% | 3.3 | 9.6% |
| Public administration | 17.4% | 3.6 | Not published |
| Utilities | 12.7% | 5.1 | 5.7% |
The last column is the company-side clock, and it runs separately from the people. It counts business locations that closed during the year, which is what breaks a street address, a site phone number or a branch record while the company itself carries on trading.
Data decay rates by state
Geography matters too, though less than most territory plans assume. Among the 49 states and districts with 2024 data, the fastest decay was in District of Columbia (36.4%), Colorado (35.6%), Wyoming (35.6%). The slowest was in Connecticut (27.9%), Pennsylvania (27.6%), Hawaii (27.6%).
| Rank | State | Ended in 12 months | Rank | State | Ended in 12 months |
|---|---|---|---|---|---|
| 1 | District of Columbia | 36.4% | 26 | Oregon | 31.2% |
| 2 | Colorado | 35.6% | 27 | Maine | 30.9% |
| 3 | Wyoming | 35.6% | 28 | South Dakota | 30.6% |
| 4 | Montana | 34.2% | 29 | Kansas | 30.5% |
| 5 | Delaware | 33.8% | 30 | Kentucky | 30.5% |
| 6 | New Mexico | 33.8% | 31 | Indiana | 30.4% |
| 7 | Idaho | 33.3% | 32 | New Hampshire | 30.4% |
| 8 | South Carolina | 33.2% | 33 | West Virginia | 30.2% |
| 9 | Mississippi | 33.0% | 34 | Virginia | 30.2% |
| 10 | Nevada | 32.7% | 35 | Rhode Island | 30.0% |
| 11 | Arizona | 32.6% | 36 | Minnesota | 30.0% |
| 12 | Georgia | 32.6% | 37 | New York | 29.7% |
| 13 | Tennessee | 32.5% | 38 | Nebraska | 29.7% |
| 14 | Utah | 32.4% | 39 | Washington | 29.6% |
| 15 | Arkansas | 32.2% | 40 | California | 29.4% |
| 16 | Louisiana | 32.2% | 41 | Ohio | 29.2% |
| 17 | Missouri | 32.1% | 42 | Massachusetts | 29.0% |
| 18 | Vermont | 31.9% | 43 | Iowa | 28.8% |
| 19 | Oklahoma | 31.7% | 44 | Wisconsin | 28.6% |
| 20 | Texas | 31.6% | 45 | Illinois | 28.2% |
| 21 | Alabama | 31.6% | 46 | New Jersey | 28.2% |
| 22 | Maryland | 31.5% | 47 | Connecticut | 27.9% |
| 23 | North Dakota | 31.4% | 48 | Pennsylvania | 27.6% |
| 24 | North Carolina | 31.3% | 49 | Hawaii | 27.6% |
| 25 | Florida | 31.2% |
About 9 percentage points separate the fastest state from the slowest, against a spread more than three times that wide across industries. So if you are choosing one adjustment to make, make it industry mix. Geography is the second pass, and it earns its keep when a territory sits at the top of this table.
Does decay change with age and seniority?
Yes, and more sharply than most refresh schedules allow for. Workers aged 25 to 34 lost 35.0% of their stable jobs within a year in 2024, against 21.8% for workers aged 55 to 64. The reasons differ, which matters if you are deciding whether to re-verify or retire a record. Younger workers mostly move straight into another job and stay reachable. The rise again after 65 is retirement, and those contacts are gone for good.
| Worker age | Stable jobs that ended within 12 months | Moved straight into another stable job | Contact half-life (years) |
|---|---|---|---|
| 22 to 24 | 48.3% | 25.5% | 1.0 |
| 25 to 34 | 35.0% | 17.8% | 1.6 |
| 35 to 44 | 26.7% | 12.0% | 2.2 |
| 45 to 54 | 22.4% | 9.2% | 2.7 |
| 55 to 64 | 21.8% | 6.7% | 2.8 |
| 65 and over | 30.5% | 5.4% | 1.9 |
Occupation tells a similar story. Of the groups below, managers have the longest median tenure with their employer and sales workers the shortest, and median tenure for all workers slipped from 4.1 years in 2022 to 3.9 in 2024.
| Occupation | Median years with employer, Jan 2020 | Jan 2022 | Jan 2024 |
|---|---|---|---|
| All workers | 4.1 | 4.1 | 3.9 |
| Management occupations | 5.8 | 6.2 | 5.7 |
| Professional and related | 4.6 | 4.7 | 4.5 |
| Office and administrative support | 4.1 | 3.7 | 3.6 |
| Sales and related | 3.3 | 3.4 | 3.3 |
At the top of a company, change is more frequent than tenure figures suggest. In 2025, 63.1% of active SEC-reporting operating companies filed at least one 8-K under Item 5.02, the disclosure for officer and director changes, and that share stayed between 62.2% and 63.9% every year from 2019. That is not an executive turnover rate: in 200 of those filings we read, 37% concerned directors only and 20.5% concerned only pay.
So we read every 2025 Item 5.02 filing for a random 200 of the companies that filed one. 86 of them, or 43%, changed or announced a change of chief executive or chief financial officer. Scaled to all filers, that means 27.1% of active SEC-reporting companies had a CEO or CFO change in 2025, within a sampling range of 22.9% to 31.5%. An account list keyed to the C-suite loses about a quarter of its top names in a year, even at companies where the wider workforce is stable.
Young and small companies go stale fastest
The company a contact works for tells you something before you look at the contact at all. Age predicts how fast its people leave and how fast its locations close. In 2024, 48.1% of stable jobs at companies under two years old ended within a year, against 29.9% at companies 11 years or older.
| Company age | Stable jobs that ended within 12 months (2024) | Business locations that closed (2023) |
|---|---|---|
| 0 to 1 years | 48.1% | 25.7% |
| 2 to 3 years | 44.9% | 14.0% to 18.1% |
| 4 to 5 years | 43.2% | 11.5% to 12.5% |
| 6 to 10 years | 40.3% | 9.9% |
| 11 years or more | 29.9% | 7.1% to 8.5% |
Size works the same way for people, and the opposite way for places. Stable jobs end faster at companies under 250 employees than at companies with 500 or more, which is the pattern most teams expect. The location figures are the surprise. In 2023, 16.1% of locations belonging to firms with 1 to 4 employees closed, against 2.7% for firms with 20 to 99 employees and 6.4% for firms with 10,000 or more. Large enterprises are always opening and shutting offices, stores and branches. So on your enterprise accounts, the site address goes stale faster than the company record it hangs off.
| Company size | Stable jobs that ended within 12 months (2024) | Contact half-life (years) |
|---|---|---|
| 0 to 19 employees | 35.3% | 1.6 |
| 20 to 49 | 36.4% | 1.5 |
| 50 to 249 | 34.4% | 1.6 |
| 250 to 499 | 32.7% | 1.7 |
| 500 or more | 29.9% | 2.0 |
523,958 US employer firms closed in 2023, 9.5% of the firms operating a year earlier and the highest rate since 2009. Nine in ten of them had fewer than five employees. The firms that closed held 2.0% of US jobs, so a list weighted toward mid-size and large accounts loses far fewer company records to closure than the headline rate suggests.
Is B2B data decaying faster than it used to?
It is worth asking, because every vendor blog implies the answer is yes. It is no. Job churn is lower now than it was at the start of the century. 34.9% of stable jobs ended within a year in 2001. The rate fell to 28.5% after the financial crisis, climbed back to 31.6% in 2019, jumped to 34.2% in 2020 and was down to 30.5% by 2024. For bachelor's degree holders the same path ran from 21.8% in 2010 to 24.7% in 2019, peaked at 27.0% in 2020, then fell back to 24.8% in 2024.
Census job-to-job data runs about 18 months behind, so it cannot tell you about this year. Monthly turnover data from the Bureau of Labor Statistics can, and it points the same way.
Source US Bureau of Labor Statistics, Job Openings and Labor Turnover Survey, seasonally adjusted quits rate, total nonfarm
Method We added the monthly quits rates for January to July of each year from 2006 to 2026 and compared the same seven months across years.
So what Contact data is going stale more slowly in 2026 than in any recent year. In professional and business services, quits for those seven months were 14.2%, the lowest since 2010. A slower year is a good time to re-baseline a database, because the fix holds for longer.
What a 10,000-contact list looks like after a year
Rates are easier to argue with than lists, so put the 2024 numbers on one. Take 10,000 contacts with bachelor's degrees, each in a stable job, spread across US industries in line with the national mix. Over 12 months, here is what happens to them.
- Left the employer on file: about 2,480 contacts. Every one of them now has a wrong title, email and direct dial.
- Moved straight into another stable job: about 1,000 of those. They are still reachable buyers, just somewhere else.
- Left work for an extended period: about 1,170, through retirement, study, caregiving or unemployment.
- Everything else: about 310, mostly people who moved into a short-term job first.
Then it compounds. At the same pace, about 4,345 of the 10,000 will have left the employer on file after two years, and about 5,747 after three. Treat those as a floor, not a forecast. They leave out promotions and internal moves, which no public source measures, and they leave out the typos, bad merges and records that were wrong on the day you bought them. We all know a bought list arrives with some of that already in it.
Which leaves you with one decision worth making deliberately: set the re-verification clock from your own list, not from an industry average you read somewhere. Segment it by industry first, by company age and size second, and by contact age third. A finance-heavy list of senior buyers can wait out the year. A list of young workers in services, construction or retail cannot, and the 2.1% a month everyone quotes will quietly tell you otherwise.
How we measured it, and the limits
People. Contact-level rates come from the US Census Bureau's LEHD Job-to-Job Flows, built from state unemployment insurance wage records that cover most private and public employment. We used stable jobs, meaning jobs held for at least a full quarter, because B2B contacts are rarely in short-term work. For each group we multiplied the share of stable jobs that survived each quarter of 2024 and subtracted the result from one. That gives the share of jobs that ended within 12 months. Half-lives assume the same yearly rate continues. State figures use the state where the job is located.
Companies. Company closures and location closures come from the Census Bureau's Business Dynamics Statistics for 2023, the latest release. A firm counts as closed when all of its locations shut down. The closure rate divides 2023 closures by the number of firms operating in 2022. Location closure rates are the Census published figures.
Recent direction. Figures for 2025 and 2026 come from the BLS Job Openings and Labor Turnover Survey. Its rates count events rather than people, so we only use them to compare years, never as a decay rate.
Leadership, names and addresses. These come from the SEC's bulk submissions file, downloaded 17 September 2026 and covering filings through 16 September 2026. A company counts as active in a year if it filed a 10-K or 10-Q that year. CEO and CFO changes come from reading every 2025 Item 5.02 filing for a random 200 of the 4,367 companies that filed one, counting announced future departures and interim appointments, then scaling to all filers. Name changes are EDGAR's recorded former names, excluding formatting-only edits. Address changes compare the business address on the first and last 2025 filing for 499 random companies, a median of 289 days apart, so they are a lower bound. SEC registrants are larger than the typical company in a B2B list.
Limits. These are measurements of the events that make records go stale, not audits of any database. A job can end without the person's record being wrong if the buyer already updated it, and a record can be wrong without any job change. Government data does not observe title changes at the same employer, email domain changes or phone number porting. Self-employed people and some federal workers are outside the Census job data. The 10,000-contact example uses the national industry mix for degree holders. A real list with a different mix will decay at a different rate, and the industry and state tables are the way to adjust for that.

Frequently asked questions
What is the B2B data decay rate in 2026?
For contacts with a bachelor's degree in stable jobs, 24.8% left their employer within 12 months in 2024, the latest full year of Census data. Across all workers it was 30.5%. Monthly turnover data shows fewer people leaving jobs in 2026, so this year's rate is likely a little lower.
How much does B2B data decay per month?
About 2.3% a month for degree-holding contacts and 3.0% for all workers, based on the 2024 annual rates. The rate is higher in services, retail and construction and lower in finance, utilities and government.
Is the 30% annual data decay figure accurate?
Not as a single number. We could not find a primary source with a published method for it, and the earliest appearance we found is a 2016 blog post that gave no source. Measured against Census data, 30.5% of all stable US jobs ended within a year in 2024, so 30% is close for the workforce as a whole. It overstates decay for degree-holding contacts, at 24.8%, and badly understates it for services and retail.
Which industries have the highest data decay?
Administrative and support services (47.5%), accommodation and food services (48.3%) and agriculture had the highest shares of stable jobs ending within a year in 2024. Utilities (12.7%), public administration (17.4%) and finance and insurance (19.2%) had the lowest.
How often should a B2B database be refreshed?
Base it on how fast your list decays. At a quarter of contacts leaving a year, a quarterly refresh keeps most of a degree-holder list within about 7% of accurate. Lists weighted to young workers, services or retail need more frequent checks. Senior finance and government lists can go longer.
Related articles
- US business registries: all 51 ranked by accessibility
- Firmographic data sourcing: why real-time extraction beats static databases
- How to select a B2B data provider
- Best B2B data enrichment tools
Sai is a data infrastructure enthusiast who has spent the past two to three years following the AI space closely, from the infrastructure layer to the fast-growing world of data for AI. He is genuinely curious about how modern data pipelines get built and where the data industry is heading, and he writes insightful pieces on the core topics that shape this niche.