
Firmographic vs. Technographic Data: What Each One Actually Tells You
Firmographic data describes what a company is: industry, headcount, revenue, location, ownership. Technographic data describes what a company’s public web presence reveals about the tools it runs. The one-line version is easy.
The operational version of the firmographic vs technographic data question is harder, because the two datasets resolve to different units and go stale on different clocks. That gap is where account scores quietly break.
This guide answers four questions: what each dataset reports at the field level, how each one breaks in practice, which differences determine how you model and refresh them, and where each one earns its keep across industries. The comparison table comes first, because that is what you came for.
Quick Digest
- The core distinction: Firmographic data records who a company is (industry, headcount, revenue, HQ, ownership) and resolves to a legal entity. Technographic data records which tools a company’s web footprint reveals and resolves to a domain.
- At a glance: Eight dimensions separate them: what each answers, unit of observation, typical fields, sourcing, structural blind spots, rate of change, workable refresh cadence, and characteristic failure mode.
- Firmographic reality check: Registry fields are observed; private-company revenue and headcount are modeled. The U.S. logged 531,423 new business applications in June 2026 alone, so the firmographic universe is an ingest stream, not a fixed list.
- Technographic reality check: A 2024 USENIX Security study found fingerprinting tools labeled 94.8% of app releases correctly in ideal conditions, with up to an 80% performance drop against real-world deployments.
- Key differences that matter: Unit of observation and decay clock drive everything downstream. Joins break on legal entity vs. domain, and each dataset needs its own refresh policy.
Firmographic vs. Technographic Data at a Glance
The fastest way to see what separates firmographic and technographic data is side by side. Eight dimensions matter operationally, and only the first three show up in most definitions.
| Dimension | Firmographic data | Technographic data |
|---|---|---|
| What it answers | “What kind of company is this?” | “What tools does this company appear to run?” |
| Unit of observation | Legal entity | Domain / web property |
| Typical fields | Industry code (NAICS), headcount, revenue, HQ and locations, ownership, funding | Detected products, tag and script fingerprints, job-posting mentions, integration listings |
| How it’s sourced | Government registries, filings, company profiles, aggregators | Crawling page code, DNS/MX records, job postings, public disclosures |
| What it structurally cannot see | Private-company financials (modeled, not observed) | Backend systems that leave no public fingerprint |
| How fast it changes | Lumpy and event-driven: funding, M&A, layoffs, relocation | Continuous and silent: tools swap with no announcement |
| Refresh cadence that works | Event-triggered | Calendar-based re-detection |
| Most common failure mode | Modeled fields treated as observed facts | A detection treated as proof of active use |
The two rows that do the most work are unit of observation and rate of change. The first decides how the datasets join. The second decides how you keep either one true.
Common oversimplification: “Firmographics tell you who a company is; technographics tell you what it uses.” True, and not useful. Both are company-state attributes. What separates them operationally is the unit they resolve to and the clock they decay on, because those two properties dictate how you model, join, and refresh them.
Firmographic Data: What It Reports and How It Breaks
Firmographic data is the set of attributes that describe a company as a business entity. The catch: not all firmographic fields are equally real. A portion is observed from authoritative records, and the rest is modeled on top of them.
The fields, and where each one actually comes from
| Field | Source of truth | Observed or modeled? | What makes it stale |
|---|---|---|---|
| Legal name, formation, status | Government registries and filings | Observed | M&A, renaming, dissolution |
| Industry code (NAICS) | Assigned classification | Assigned, often inconsistently | Reclassification, and revisions to NAICS itself |
| Headcount | Profile and listings data | Scraped proxy | Layoffs and hiring lag profile updates |
| Revenue (private companies) | Vendor estimation models | Modeled | Model refresh, not company change |
| HQ and locations | Filings, websites, listings | Observed with lag | Relocation, consolidation |
| Ownership and funding | Filings, announcements | Observed, event-driven | Every deal changes the tree |
The observed fields are as good as their registries, and in the US that quality is uneven enough that we ranked all 51 state registries by how accessible each state’s filings actually are. The scale of the ingest is the part teams underestimate.
531,423 new U.S. business applications were filed in June 2026 (149,714 of them high-propensity), per the U.S. Census Bureau’s Business Formation Statistics. That volume arrives every month, before a single existing company changes its name, owner, or address. Source: U.S. Census Bureau, July 2026.
For how these fields get sourced and kept current, see our guide to firmographic data sourcing and the complete guide to firmographics. We won’t re-explain the basics here.
The three fields that quietly lie
Three firmographic fields carry error that practitioners routinely treat as fact. Revenue for private companies is modeled, inferred from headcount, industry, and peer benchmarks; two providers disagree because their models differ, not because one found the truth. Headcount counts profiles, not employees, which over-counts white-collar workforces and lags layoffs by months. A single industry code flattens a multi-line business into one bucket, and the code set itself moves.
Non-obvious failure mode: A firmographic field can go stale without the company changing at all. NAICS is revised on a five-year cycle, and the 2027 revision will be the sixth since 1997; OMB published its proposed updates for public comment in July 2026. When the classification system moves, your “stable” industry field moves with it.
Technographic Data: What It Reports and How It Breaks
Technographic data, sold as b2b technographic data in most catalogs, is the set of signals about which tools a company appears to run, inferred from its public web footprint. The word doing the work in that sentence is inferred.
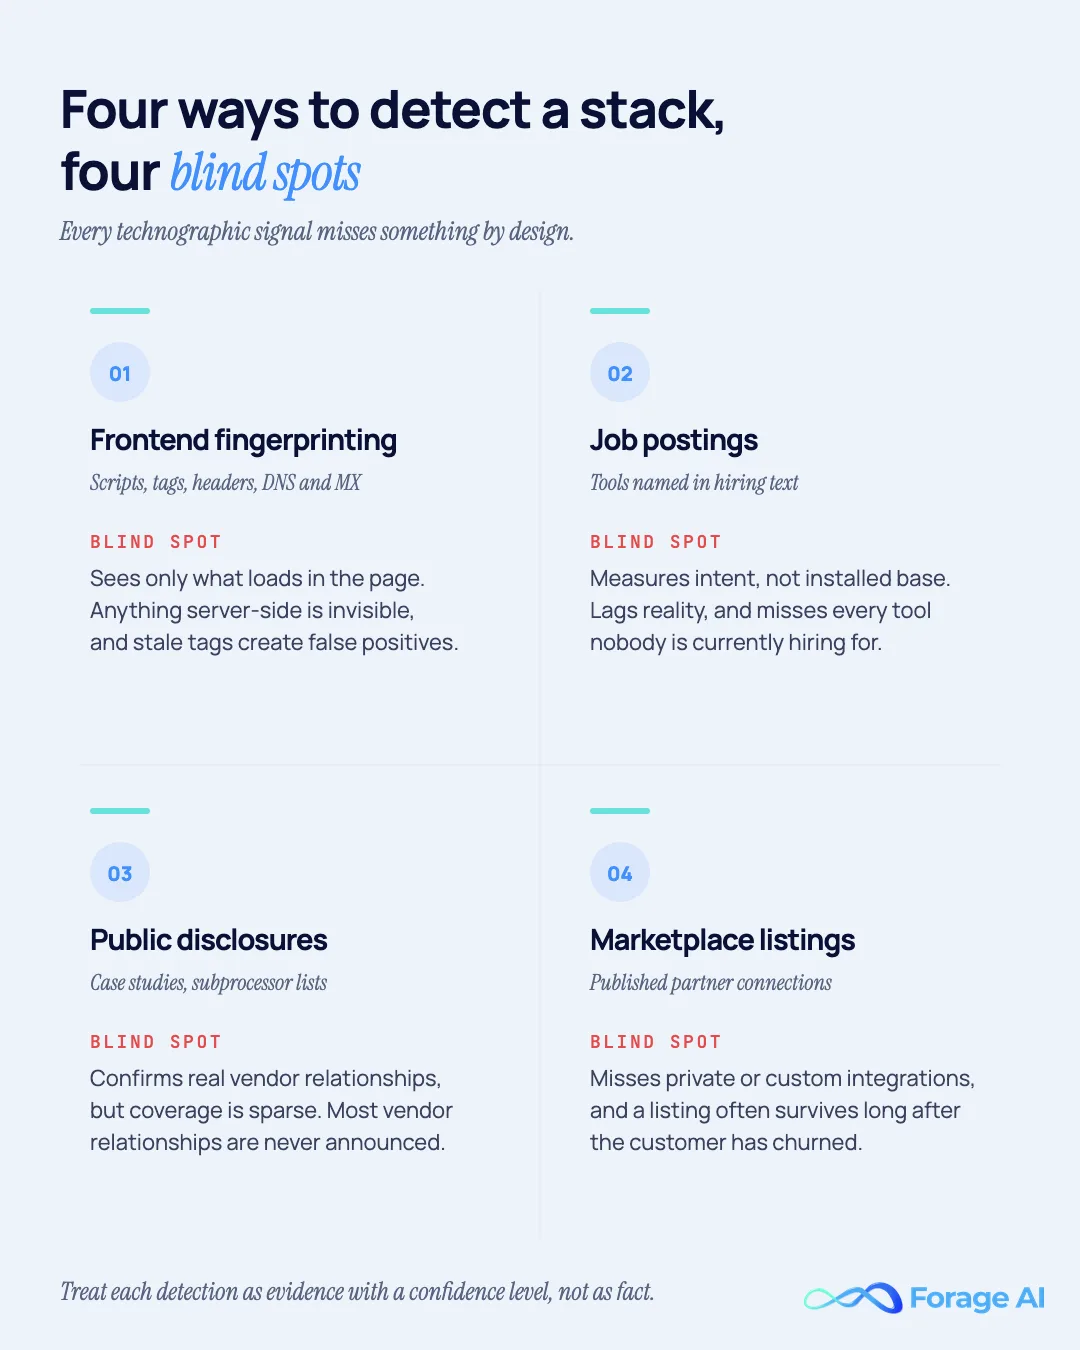
The four detection methods, and each one’s blind spot
| Method | What it sees | What it misses | Error direction |
|---|---|---|---|
| Frontend fingerprinting (scripts, tags, headers, DNS/MX) | Marketing and web-layer tools that load in the page | Anything server-side | False positives from stale tags |
| Job-posting analysis | Tools named in hiring text | Tools nobody is hiring for | Lags reality; measures intent, not installed base |
| Public disclosures (case studies, subprocessor lists) | Confirmed vendor relationships | The unannounced majority | Sparse coverage |
| Integration and marketplace listings | Published partner connections | Private or custom integrations | Listing survives after churn |
Frontend fingerprinting supplies most of the volume, and it inherits the structure of the web itself. The HTTP Archive’s 2025 Web Almanac found 90% or more of pages load at least one third party, with the top third-party domains dominated by Google services. When nearly every site carries a tag manager, “has Google Tag Manager” tells you almost nothing about an account.
Job postings are the second-largest signal, and they measure intent rather than installed base. Indeed Hiring Lab’s July 2026 analysis showed software development postings rising nearly 15% from early 2025 while overall U.S. postings fell 7%, with 71% of the increase coming from senior roles. Postings tell you what a company is building toward, on a lag, with a seniority skew.
Why “detected” is not “in use,” and “not detected” is not “not used”
The accuracy claims on vendor sites come from ideal conditions. Independent measurement looks different.
Fingerprinting accuracy drops by up to 80% in the wild. A 2024 USENIX Security study from Stony Brook University tested six web application fingerprinting tools against 1,360 application releases: 94.8% were correctly labeled by at least one tool in ideal conditions, but performance fell by as much as 80% against real-world deployments. Source: Kondracki and Nikiforakis, USENIX Security ’24.
The error runs both directions. A stale script block keeps a churned vendor “detected” for months. A backend data warehouse never appears at all.
The silent modeling error: Absence of a detection is absence of evidence, not evidence of absence. Store “not detected” as NULL, never as FALSE. Scoring models that treat missing signal as “does not use” systematically punish companies with light web footprints.
What Are the Key Differences Between Firmographic and Technographic Data?
Most technographic data vs firmographic data comparisons stop at the definition row. The rows that matter are the ones that decide how the two datasets behave inside your warehouse: firmographics are slow-moving attributes of a legal entity, technographics are fast-decaying observations of a domain.
| Dimension | Firmographic data | Technographic data |
|---|---|---|
| Resolution unit | Legal entity (company, subsidiary, parent) | Domain or web property |
| Sourcing mechanism | Registries, filings, profiles, aggregation | Crawling, fingerprinting, posting analysis |
| Observed vs. modeled | Mixed: registry fields observed, revenue and headcount modeled | Nearly all inferred from indirect signals |
| Dominant error | Staleness and model disagreement | False positives (stale tags) and false negatives (backend invisibility) |
| What drives change | Discrete corporate events | Continuous procurement and replacement cycles |
| Refresh policy that works | Event-triggered (funding, M&A, layoffs, domain change) | Scheduled re-detection, because change is silent |
| Join behavior | Rolls up cleanly through ownership trees | Fragments across domains and subsidiaries |
| What breaks first | Headcount and revenue after a corporate event | Any detection older than its refresh window |
The join problem, briefly. “Company” is not a join key. Firmographic records resolve to legal entities; web-detected technographics resolve to domains, and enterprises hold multiple domains while subsidiaries run their own stacks. The ground keeps moving, too: global M&A hit $4.8 trillion in 2025, up 36% year over year (Bain & Company), and every deal rewires an ownership tree. Legal Entity Identifiers help, at 3.02 million active LEIs with 99% parent reporting as of Q1 2026 (GLEIF), but that covers a fraction of the B2B universe. A domain-to-entity resolution step, carrying confidence and last-seen metadata, is still yours to build. Our data quality framework for external sources covers the validation side.
Two refresh clocks, briefly. One quarterly cadence is wrong in both directions. Firmographic change is lumpy, so refresh on triggers, not calendars. Technographic change is silent and constant: the average company manages 305 SaaS apps, and large enterprises add 21 per month even as totals stay flat at 0.07% down year over year (Zylo, 2026), while the supply side churned 1,488 products in and 1,367 out in a single year (chiefmartec, 2026). Flat totals hide furious turnover. Re-detect on a schedule, and stamp every detection with last-seen.
Where Should You Use Firmographic vs. Technographic Data?
Match the dataset to the question in front of you. Firmographics answer fit; technographics answer stack context. Neither answers timing.
| Use case | Leads | Supports | Where it shows up |
|---|---|---|---|
| Market segmentation and TAM sizing | Firmographic | Technographic refines | SaaS GTM planning, PE market maps |
| Territory and account assignment | Firmographic | Rarely needed | Sales ops across industries |
| Displacement campaigns (“replace tool X”) | Technographic | Firmographic filters | Martech, DevTools, security vendors |
| Integration and partner pitches | Technographic | Firmographic sizes the account | ISVs selling into installed platforms |
| Risk and onboarding review | Firmographic (ownership trees) | Rarely needed | Financial services, insurance |
| Supplier and distributor mapping | Firmographic | Technographic where digital | Manufacturing, logistics |
| Lead scoring and routing | Firmographic base | Technographic as weighted evidence | RevOps everywhere |
The decision rule compresses well. If the question is “is this company the right kind and size,” that is firmographic segmentation and firmographic targeting territory. If it is “does their stack make us relevant,” that is technographic. If it is “are they in-market right now,” that is neither; intent data is a different dataset with its own decay behavior, and bolting it on fixes nothing here.
Expert Insights
“For the first time in 15 years, the growth of the martech landscape effectively flattened. … But ‘flat’ is also a misleading word to describe what’s happening. Because underneath that near-zero net growth, the market is churning furiously: 1,488 products were added. 1,367 products were removed.”
Scott Brinker, editor of chiefmartec and VP Platform Ecosystem at HubSpot
“AI is quickly becoming the most expensive ‘invisible worker’ in the organization. The real risk ahead is velocity. How quickly applications enter the environment and are replaced will matter more than total app counts.”
Ben Pippenger, Co-founder and VP of Strategic Partnerships at Zylo
Where technographics are not worth buying: ICPs whose relevant systems are entirely backend (databases, ERP, core banking), and industries with thin web footprints, yield little detection signal. Spend that budget on firmographic depth instead. When both datasets earn their place, the next step is segmentation built on live data; if you would rather buy the enrichment layer than build it, start with our review of B2B data enrichment tools.

Frequently Asked Questions
What is technographic data?
Technographic data is information about the technologies a company appears to use, inferred from public signals: scripts and tags on its websites, DNS and mail records, job postings, disclosures, and integration listings. It is evidence, not inventory; every detection carries a confidence level and an expiry. The strongest implementations store last-seen dates and treat missing detections as unknown rather than negative.
What are technographics?
Technographics are the attribute family built from that data: which CRM, analytics, cloud, and marketing tools an account appears to run, plus adoption and replacement patterns over time. B2B teams use technographics to segment by stack, qualify fit for integrations, and time displacement campaigns. Their reliability depends entirely on the detection method behind each attribute.
What is firmographic data?
Firmographic data is the set of company-identity attributes (industry, headcount, revenue, location, ownership, funding) used to segment and target B2B markets the way demographics segment consumer ones. Registry-sourced fields are observed; revenue and headcount for private companies are usually modeled. Our complete guide to firmographics covers the full field list.
How do you use technographic data alongside firmographic data?
Build the firmographic layer first, since entity identity is the spine every other attribute hangs on. Then resolve technographic detections from domains to those entities through an explicit entity-resolution step, carrying confidence and last-seen metadata through the join. Score with firmographics as the base and technographics as weighted evidence, and refresh the two on separate policies: triggers for firmographics, a calendar for technographics.
How do you verify technographic data accuracy?
Sample it against ground truth you control: closed-won and closed-lost accounts, where your reps learned the real stack. Check false positives (tools detected but churned) and false negatives (tools in use but invisible) separately, because they distort different decisions. Ask providers for per-category detection methods and last-verified dates rather than a single accuracy percentage; the 2024 USENIX Security measurements show accuracy varies enormously between ideal and live conditions.
Related Articles
- Firmographic Data Sourcing: Why Real-Time Extraction Beats Static Databases: Why event-speed extraction outperforms static database licensing for firmographic accuracy
- The Complete Guide to Company Data Extraction: Sources and methods for extracting firmographics, technographics, and financials from the web
- Data Quality Framework & Quality Checklist for External Sources: How to validate freshness, completeness, and accuracy of third-party data before it enters your warehouse
- Modern Firmographic Segmentation Using Clustering and LLMs: Building dynamic segments once your firmographic and technographic layers are joined
Sai is a data infrastructure enthusiast who has spent the past two to three years following the AI space closely, from the infrastructure layer to the fast-growing world of data for AI. He is genuinely curious about how modern data pipelines get built and where the data industry is heading, and he writes insightful pieces on the core topics that shape this niche.