
CEO Turnover Rate Statistics: How Often US Public Companies Change Their CEO or CFO
This article is for informational purposes only and does not constitute investment or financial advice. It measures disclosure events in public filings, not company performance.
Updated 2026-10-15. All figures computed by Forage AI from SEC EDGAR bulk submissions data as it stood on 2026-10-13. Retrospective, not projected. Next update: after the close of 2026 Q4.
Ask four reputable publishers how often a US public company changes its chief executive and you get a count of 453, a count of 59, a rate of 11.1% and a rate of 12.5%. None sits on the same population, and only two say what counts as a turnover event.
So anyone writing one sentence about CEO turnover picks a number and hopes nobody asks where it came from. That is avoidable. These disclosures have been public and free since August 2004.
We measured it across 31 quarters of SEC filings and 2,831 hand-written labels. This page gives the measured rate for US SEC-reporting companies by quarter and by sector, the denominator it sits on, and the method to recompute it.
Quick Digest
- The rate: 32.7% of active US SEC-reporting operating companies changed or announced a change of CEO or CFO in 2025, on 5,823 companies, 95% interval 26.4% to 39.2%.
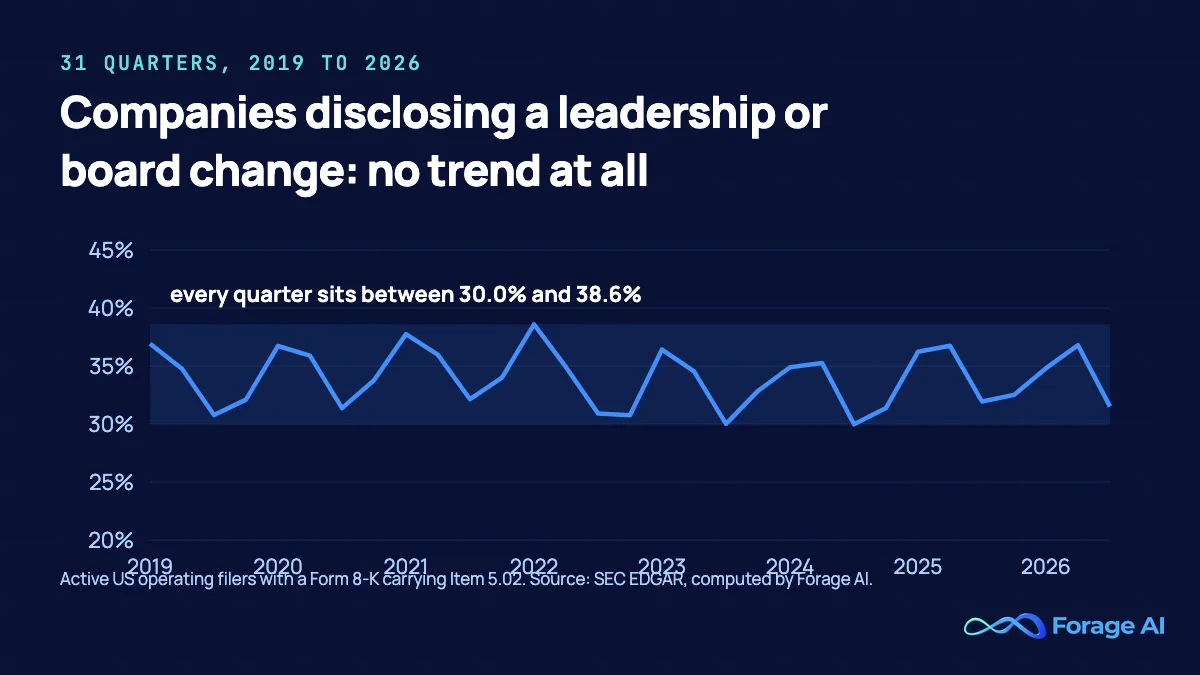
- The flat part: the share filing any officer-or-director disclosure has stayed between 30.0% and 38.6% in all 31 quarters since 2019.
- The part that moved: among those that filed, the hand-measured share with a CEO or CFO change rose from 31.7% in 2019 to 45.0% in 2025.
- The trap: of 320 filings read by a person, 25.0% involved a CEO or CFO. Counting Item 5.02 filings overstates C-suite change roughly fourfold.
How often do US public companies change their CEO or CFO?
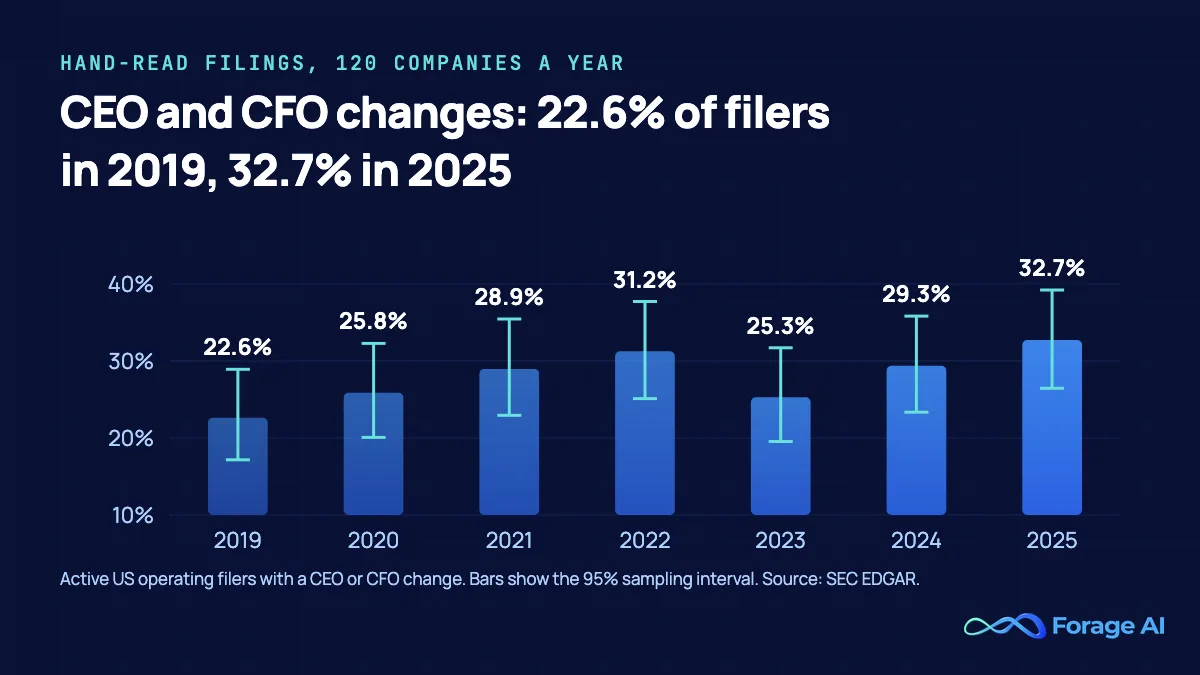
In calendar 2025, 32.7% of active SEC-reporting operating companies disclosed a change of chief executive or chief financial officer. The denominator is 5,823 companies, so roughly 1,904 of them, and the 95% Wilson interval runs 26.4% to 39.2%. Every figure here is as of 2026-10-13.
Source Forage AI computation from SEC EDGAR Form 8-K Item 5.02 filings
Method a full-population filer rate of 72.64% multiplied by a hand-labelled share of 45.0%, 54 of 120 sampled companies; 95% interval 26.4% to 39.2%, sampling error on the share only
So what roughly one company in three, on a denominator an index-based rate cannot give you
An active operating company is one filing on the trailing-twelve-month rule, excluding SIC 6189 securitization trusts and SIC 6770 blank cheque entities. The figure counts a CEO or CFO change, an announced future departure, an interim or acting appointment, and officer replacement in a merger or de-SPAC. Formal appointment to an office someone already filled on an interim basis counts, as a 5.02(c) appointment. Adding a title you hold already does not.
We have published an annual figure before, 27.1%, and that page owns every measured decay figure in this family. The two are not in conflict, and we would rather print the arithmetic than leave a reader to find it.
| Figure | Period | Universe | Sampled share with a CEO or CFO change | Share filing an Item 5.02 | Implied rate (95% interval) |
|---|---|---|---|---|---|
| Published on our data decay page | Calendar 2025 | All operating filers, including securitization trusts and blank-check shells | 43% of 200 companies read | 63.09% | 27.1% (22.9% to 31.5%) |
| This page | Calendar 2025 | Operating filers, excluding securitization trusts and blank-check shells | 45% of 120 companies read | 72.64% | 32.7% (26.4% to 39.2%) |
Both factors moved. The pipeline reproduces the September run to four decimal places on the identical definition, 6,922 active companies and 4,367 filers for 0.6309 both times, so the gap is universe plus sampling, not an error. The universe does most of the work: 911 active SIC 6189 trusts filed zero Item 5.02 filings in 2026 Q3, and excluding entities with no management at all moves the filer rate about nine points.
Two limits travel with the number. SEC registrants are larger and more regulated than any real prospect list, so this rate does not transfer to a private-company file. And the 63.1% filer rate published beside it is not a turnover rate, for reasons the fourth section measures.
CEO and CFO changes by quarter, 2019 to 2026
And so to the cut nobody else publishes. There are two quarterly series here, and they measure different things.
The first is the Item 5.02 filing rate at full population, with a floor of 30.0% in 2023 Q3 and a ceiling of 38.6% in 2022 Q1. It carries no sampling error, being a census of the bulk file rather than a draw from it. The denominator falls about 11% across the period as the filer population shrinks, which is why a rate holds up here where a count would mislead.
| Quarter | Active filers | Filed an Item 5.02 | Quarter | Active filers | Filed an Item 5.02 |
|---|---|---|---|---|---|
| 2019Q1 | 6,527 | 36.9% | 2023Q1 | 6,591 | 36.4% |
| 2019Q2 | 6,498 | 34.8% | 2023Q2 | 6,529 | 34.5% |
| 2019Q3 | 6,489 | 30.8% | 2023Q3 | 6,477 | 30.0% |
| 2019Q4 | 6,365 | 32.1% | 2023Q4 | 6,378 | 32.9% |
| 2020Q1 | 6,342 | 36.7% | 2024Q1 | 6,342 | 34.9% |
| 2020Q2 | 6,274 | 35.9% | 2024Q2 | 6,254 | 35.3% |
| 2020Q3 | 6,283 | 31.4% | 2024Q3 | 6,211 | 30.0% |
| 2020Q4 | 6,225 | 33.8% | 2024Q4 | 6,037 | 31.4% |
| 2021Q1 | 6,329 | 37.8% | 2025Q1 | 6,041 | 36.2% |
| 2021Q2 | 6,444 | 36.0% | 2025Q2 | 5,958 | 36.7% |
| 2021Q3 | 6,577 | 32.1% | 2025Q3 | 5,926 | 31.9% |
| 2021Q4 | 6,639 | 34.0% | 2025Q4 | 5,823 | 32.5% |
| 2022Q1 | 6,691 | 38.6% | 2026Q1 | 5,852 | 34.8% |
| 2022Q2 | 6,690 | 34.9% | 2026Q2 | 5,822 | 36.8% |
| 2022Q3 | 6,657 | 30.9% | 2026Q3 | 5,815 | 31.5% |
| 2022Q4 | 6,596 | 30.8% |
The sawtooth repeats every year: Q1 and Q2 heavy, Q3 lightest. 2026 Q4 is incomplete and absent.
The second series is the measured CEO or CFO rate, and it exists for eight quarters. Fifty company-quarters were drawn per quarter, and every in-quarter Item 5.02 filing of each was read by a person. It runs 6.5% to 13.4%.
| Quarter | Company quarters read | With a CEO or CFO change | Measured quarterly rate (95% interval) |
|---|---|---|---|
| 2024Q4 | 50 | 11 | 6.9% (4.0% to 11.1%) |
| 2025Q1 | 50 | 13 | 9.4% (5.8% to 14.3%) |
| 2025Q2 | 50 | 11 | 8.1% (4.7% to 13.0%) |
| 2025Q3 | 50 | 21 | 13.4% (9.4% to 17.8%) |
| 2025Q4 | 50 | 10 | 6.5% (3.6% to 10.7%) |
| 2026Q1 | 50 | 14 | 9.8% (6.1% to 14.5%) |
| 2026Q2 | 50 | 15 | 11.0% (7.0% to 16.1%) |
| 2026Q3 | 50 | 12 | 7.6% (4.5% to 11.8%) |
Eight quarters, because earlier ones carry an annual hand-label and nothing finer, so a per-quarter CEO or CFO rate before 2024 Q4 does not exist and is not shown. At fifty company-quarters a point, the honest reading of 13.4% in 2025 Q3 against 6.5% in 2025 Q4 is two adjacent quarters one sample wide apart, not a turning point. The trend claim rests on the annual series.
[NEG-CALLOUT] A quarterly series that looks measured but is an annual share painted across four quarters is the thing this page exists to replace, so here is which of ours is which. The first is measured every quarter at full population. The second is measured every quarter by hand. Neither is a scaled annual figure, and the two never share an axis.
One convention, stated because it changes the answer. Announcement against effective date moves events between adjacent quarters as routine, so a quarterly series has to pick one. Ours is announcement.
What changed is inside the filings, not the number of them
Put the two measurements side by side and the finding is hard to miss. The population Item 5.02 filer rate moved from 71.4% in 2019 to 72.6% in 2025, which is flat. The hand-measured share of those filers with a CEO or CFO change moved from 31.7% to 45.0%. So the implied company-level rate moved from 22.6% to 32.7%, and a filing-count signal would have shown nothing at all over the same seven years.
| Year | Companies read | With a CEO or CFO change | Share of filers sampled | Filed an Item 5.02 (all filers) | Implied rate for all active filers (95% interval) |
|---|---|---|---|---|---|
| 2019 | 120 | 38 | 31.7% | 71.4% | 22.6% (17.2% to 28.9%) |
| 2020 | 120 | 43 | 35.8% | 72.1% | 25.8% (20.1% to 32.2%) |
| 2021 | 120 | 48 | 40.0% | 72.4% | 28.9% (22.9% to 35.4%) |
| 2022 | 120 | 52 | 43.3% | 72.1% | 31.2% (25.1% to 37.7%) |
| 2023 | 120 | 42 | 35.0% | 72.2% | 25.3% (19.5% to 31.7%) |
| 2024 | 120 | 49 | 40.8% | 71.9% | 29.3% (23.3% to 35.8%) |
| 2025 | 120 | 54 | 45.0% | 72.6% | 32.7% (26.4% to 39.2%) |
| 2026 (to 13 October) | 120 | 35 | 29.2% | 67.2% | 19.6% (14.6% to 25.4%) |
This rise is a comparison of endpoints. Comparing 2019 with 2025 the difference is significant at 5%, the linear trend across the seven years is marginal at p = 0.056, and pooling the first three years against the last three leaves a rise of 4.5 points that is not statistically detectable. What the series supports is that the measured share was higher at the end of the period than at the start. It does not support a steady year-on-year climb, and one year, 2023, falls by more than eight points.
All three tests are printed rather than chosen between. The endpoint difference gives z = 2.12 and p = 0.034. The Cochran-Armitage linear trend gives z = 1.91 and p = 0.056, reported as marginal and never rounded into significance. The pooled blocks, 35.8% against 40.3%, give z = 1.23 and p = 0.22. The direction is consistent across all three, the significance is not, and 120 companies a year is why. The trend claim rests on the company-level sample, and 2026 is year to date at 19.6%, not comparable with a full year.
The first objection is whether companies merely filed more Item 5.02s, giving each year more chances to catch a CEO or CFO change. They did not. Filings per filing company fell from 2.60 to 2.53 on the sampled frame and from 2.66 to 2.60 at full population, both moving negatively against the sampled share at r = -0.57 and -0.58, and total volume fell 9%. Any story in which companies disclose more predicts the opposite.
The second objection is whether the disclosure itself changed. No SEC staff interpretation of Item 5.02 has been published or revised since May 2009, on a guidance page the Commission was still updating in June 2024, and the Form 8-K rulemaking inside our window added a new item for cybersecurity rather than changing Item 5.02. Whatever moved, the text of the obligation did not.
What that licenses is narrow: one indicator, at one population, on one disclosure channel, was higher in 2025 than in 2019. We do not measure why.
What an 8-K Item 5.02 filing actually discloses
That gap has a cause, and it sits in the drafting of the item. Item 5.02 of Form 8-K covers the departure of directors or certain officers, the election of directors, the appointment of certain officers, and compensatory arrangements of certain officers. Its scope is officers and directors, which is wider than the C-suite. A pay-only amendment and a chief executive's exit arrive through the same door.
| What the filing actually disclosed | Filings | Share of all Item 5.02 filings (95% interval) |
|---|---|---|
| CEO change | 35 | 10.9% (8.0% to 14.8%) |
| CFO change | 45 | 14.1% (10.7% to 18.3%) |
| Another named officer | 51 | 15.9% (12.3% to 20.3%) |
| Directors only | 117 | 36.6% (31.5% to 42.0%) |
| Compensation only | 67 | 20.9% (16.8% to 25.7%) |
| No change disclosed | 5 | 1.6% (0.7% to 3.6%) |
| CEO or CFO, combined | 80 | 25.0% (20.6% to 30.0%) |
Source Forage AI computation from SEC EDGAR, Sample A, 40 filings per year 2019 to 2026 year to date, seed 20261015
Method one primary label per filing in the fixed order CEO, CFO, other named officer, director-only, compensation-only, none; 95% interval 20.6% to 30.0%
So what a measurement that treats Item 5.02 filings as executive changes overstates C-suite change roughly fourfold
Every filing's text was read and given one primary label in that fixed order. Call it the labelling rubric; it is not a product. The order has a consequence: a filing announcing a chief executive change that also sets a director's pay is labelled CEO, so the director-only and compensation-only shares are floors rather than counts. No keyword classifier assigned a label anywhere in this run. Our prior run measured a classifier agreeing with human labels on only 150 of 200 filings, which is why.
Direction is not symmetric either. Of the 320 filings, 30.6% record a departure only, 30.0% an appointment only, 16.9% both and 22.5% neither, so a feed watching for someone leaving misses most of the events.
So a filing about an officer change is usually not a departure, and is often not about an officer at all. The split shows no detectable shift since 2019, all p above 0.19, making it a standing property of the disclosure rather than a recent change. A company filing several Item 5.02s in a year is still one company. And the window has a hard floor: these disclosures start in August 2004.
Item 5.02 filings by sector
This is a cut of Item 5.02 filing rates, not of CEO or CFO turnover, because that is what the data supports. The hand-labelled samples cannot be split by division, so the sector view is pooled across the 28 complete quarters of 2019 to 2025.
| Sector (SIC division) | Mean quarterly Item 5.02 filing rate, 2019 to 2025 | Range across quarters | Active filers, 2026 Q3 |
|---|---|---|---|
| Retail Trade | 38.7% | 31.1% to 47.3% | 240 |
| Manufacturing | 37.2% | 31.3% to 42.8% | 2,082 |
| Construction | 35.6% | 26.2% to 54.2% | 72 |
| Wholesale Trade | 34.1% | 26.1% to 42.0% | 113 |
| Services | 33.9% | 29.9% to 37.5% | 1,049 |
| Agriculture, Forestry, Fishing | 32.6% | 18.8% to 47.7% | 34 |
| Transportation & Public Utilities | 32.4% | 27.7% to 38.6% | 438 |
| Finance, Insurance, Real Estate | 31.0% | 24.6% to 38.5% | 1,342 |
| Mining | 26.8% | 21.6% to 34.1% | 253 |
| Unknown / no SIC | 18.3% | 9.4% to 28.3% | 192 |
The whole range across nine divisions is about 12 points, which makes sector a weak discriminator next to the quarter of the year. A narrow spread is still a finding. It argues against the assumption that technology churns hardest, since technology sits inside Services and Manufacturing rather than at the top, and the loudest division is Retail Trade. The key is the SIC division from the first two digits of the code on the EDGAR record, the unmapped residual is reported rather than hidden at 192 companies in 2026 Q3, and cells under 30 active companies are left out.
One limit belongs here rather than in the method section. EDGAR holds no SIC history, so every historical quarter carries the classification as it stands on the pull date and a company that reclassified since 2019 is counted in its present division for its 2019 filings. EDGAR preserves former company names with from-and-to dates and preserves no former classifications at all, which we checked first-hand. Nor is this table comparable to a published sector cut: comparators use GICS, and a share of a publisher's own turnovers is not a rate per sector.
When in the year do CEO and CFO changes cluster?
The first half of the calendar year carries 54.9% of hand-labelled CEO-or-CFO-positive filings, interval 50.6% to 59.1%, on 525 positive filings. The second half carries 45.1%.
The mechanism is the more useful half. The swing belongs to Item 5.02 volume as a whole rather than to CEO and CFO changes specifically, because the CEO or CFO share within each quarter is nearly flat at 19.6%, 22.3%, 23.0% and 22.6%. So if you refresh an officer field quarterly, the first half is where the events are, and the driver is the annual-meeting and proxy calendar.
No heaviest-quarter claim is made. Q2 carries the most positive filings and Q4 the fewest, a ratio of 1.31 to 1, but Q1 and Q2 are indistinguishable at 137 against 151. Anyone who has read that Q2 is "peak exit season" has read a difference inside its own interval.
Why do the published turnover numbers disagree?
The numbers in this field are not so much wrong as not the same measurement. Ten publishers, three denominators, two opposite date conventions, and one discontinued study still circulating as current.
| Publisher | Population measured | Rate or count | Latest figure | Date convention | Cadence |
|---|---|---|---|---|---|
| The Conference Board with ESGAUGE | Russell 3000 and S&P 500 index members | Rate, labelled as such | S&P 500 12.5% projected for 2025, Russell 3000 11% | Announcement date, printed | Annual, free |
| Crist Kolder Associates | Its own 665-company portfolio of Fortune 500 and S&P 500 companies | Rate | CEO 11.1% projected for 2026, CFO 18.3% | Effective date, printed | Twice a year, free |
| Spencer Stuart | S&P 1500 | Count, with rates by industry beside it | 168 new CEOs, the most since 2010 | Not stated | Annual, free |
| Challenger, Gray & Christmas | Public, private, government and non-profit, unsized | Count | 1,226 announcements to August 2026, of which 243 at public companies | Not stated | Monthly, free |
| Russell Reynolds Associates | 13 indices, no denominator given | Count on the index page | 234 departures and 213 appointments globally in 2025 | Not stated | Quarterly, free |
| Equilar | An undefined "Equilar 500" | Count | 64 departures in 2025 | Not stated | Annual, free |
| PwC and Strategy& | The 2,500 largest global companies | Rate, well specified | 17.5%, from the 2018 edition and still circulating | Not stated | Discontinued after 2018 |
| This page | All active US operating filers, roughly 5,800 companies | Rate, with its interval | 32.7% for 2025 (26.4% to 39.2%) | Filing date, printed | Quarterly, free |
Both the Conference Board and the Crist Kolder figures are marked by their publishers as projections and labelled that way above. The Conference Board report, written with ESGAUGE, is reachable as a co-author's freely hosted copy because the publisher's own dashboard is account-gated. The Crist Kolder 2026 Volatility Report is open.
Seven mechanisms account for the disagreement, and each is something a publisher printed rather than something we assert.
- A count on an unsized universe, quoted as a national rate. The most-cited figure in the family cannot be divided by anything its publisher publishes.
- A rising count on an unfixed universe, read as rising turnover, where the publisher has itself written that it cannot track every departure.
- A share of events read as a share of companies. Sector shares that track a publisher's own portfolio composition within two points are the demonstration.
- Announcement date against effective date, chosen opposite ways by the two publishers who print the choice and unstated by the other eight.
- Interim appointments, counted by some and disclosed by few. One publisher logs the interim's arrival as a change and the departure as another, so one vacancy can produce three events.
- Two values for one year from one publisher. A Russell 3000 forced-exit figure moved from 10.6% to 14.8% between two of its own reports, both agreeing on 2024 at 14.7%. Our inference, labelled as inference: the first was annualised from data as of 3 October 2025, the second used the complete year.
- Index membership drift. Crist Kolder prints its own, 25 companies out and 28 in between its 2025 and 2026 portfolios, roughly 8% a year in the population itself.
Rate or count, the distinction nobody prints
A record count is not a record rate, because a count can set a record while the rate falls if the universe grew or the tracker's coverage improved. Every figure in the familiar 11% to 17% band is an index rate on the largest 500 to 3,000 companies, not a rate across US SEC filers. The 17.5% still in circulation gets one sentence of context: it is global, it is for 2018, and the publisher's page in October 2026 still calls it "this year's report".
Announcement date or effective date
The two publishers who print their convention print opposite ones. The Conference Board with ESGAUGE states that succession "is measured by the date of announcement rather than effective date". Crist Kolder defines turnover as "When an executive departs from a C-Suite position (as opposed to the date of announcement)". Eight of ten print neither. On an annual series the choice reclassifies events at the margin; on a quarterly series it moves them between adjacent quarters as routine, so a quarterly series that does not state its convention cannot be compared with anything, including ours.
None of this says a publisher is wrong. It says what each number counts, in their own words where they printed them. For an index-comparable annual rate on the largest companies, use the Conference Board or Crist Kolder. For all SEC filers at quarterly grain, this page.

What do tenure figures actually measure?
One objection arrives before anyone finishes the trend section: if leadership change rose, why is median tenure going up? Because the two measure different objects.
| Figure | What it measures | Population | Publisher and date | |---|---|---|---| | 4.1 years median, up from 3.9 | Tenure with the current employer at the survey date, a stock of in-progress spells moved by hiring as much as by separations | All employed wage and salary workers aged 16 and over | US Bureau of Labor Statistics, Employee Tenure in 2026, January 2026 supplement to the Current Population Survey, released 24 September 2026 | | 6.1 years median, against 5.7 in January 2024 | The same measure, management occupations | Management occupations | Same release | | Average tenure of outgoing chief executives | An average over departures at index companies | S&P 1500 | Spencer Stuart, as of 31 December 2025 | | Average tenure of sitting chief executives | A stock of incumbents at a single date | 1,664 chief executives at the largest companies in 28 markets; the US cut is the Fortune 500 | Heidrick and Struggles, as of 5 January 2026 |
The Bureau of Labor Statistics measures tenure with the current employer at survey time across the whole labour force. Ours is the flow of disclosed officer changes at roughly 5,800 SEC filers. One is a stock across the employed labour force, the other a flow across one disclosure channel, and a rise in both at once is arithmetically ordinary.
Use the tenure numbers for how long people stay, not for how often leadership changes, and if both appear in one argument, state which population each covers. "Executive tenure is collapsing" is the most repeated claim in this space, and the US data points the other way: the median rose between January 2024 and January 2026. A 52% year-over-year swing in a published global tenure average is not a believable population change and should be read as a method artefact. A study of who holds the job cannot answer how often the job changes hands, however authoritative it is on the first question. We publish no tenure figure of our own, because we did not compute one.
How to compute this yourself from EDGAR
The raw material is free and has been since August 2004, and the per-filing record carries an items field, which makes Item 5.02 filterable from free metadata without reading a single document. What is missing is not access. It is the denominator work and the hand-labelling.
- Get the corpus. The bulk
submissions.zipfrom EDGAR, 1,568,978,254 bytes and 988,781 CIKs in the 2026-10-13 file. - Build the denominator per period. Active operating companies on a trailing-twelve-month rule, excluding SIC 6189 and 6770, built from the filings present in each quarter rather than from a current filer list. That is what keeps the early years from collapsing to survivors.
- Filter on the
itemsfield. No document fetches are needed for the filing rate. - Read a sample by hand, because the rate you want is not the filing rate and that classifier agreed with human labels on only 150 of 200 filings.
A declared User-Agent with a company name and contact address is required, the published ceiling is 10 requests per second, and our run was throttled to 7 and peaked at 7.6. The build took 29 minutes and 2,831 hand labels. A quarterly re-run is an estimated 20 to 25 minutes, from the measured segments rather than a measured re-run.
# [CITABLE-CODE] Verified 2026-10-15. One request each, well under the published 10 req/s ceiling.
curl -s -A "Forage AI research agent@forage.ai" \
  "https://data.sec.gov/submissions/CIK0000789019.json" | python3 -c \
  "import json,sys; d=json.load(sys.stdin); print(d['sic'], d['sicDescription'], d['formerNames'])"
# -> 7372 Services-Prepackaged Software []

curl -s -A "Forage AI research agent@forage.ai" \
  "https://data.sec.gov/submissions/CIK0001326801.json" | python3 -c \
  "import json,sys; d=json.load(sys.stdin); print(d['name'], d['sic'], d['formerNames'])"
# -> Meta Platforms, Inc. 7370
# [{'name': 'Facebook Inc', 'from': '2005-05-06...', 'to': '2021-10-27...'}]
One real change shows why step four is not optional. Vulcan Materials Company, CIK 1396009, named here only as a filer whose documents are public, carries four Item 5.02 submissions for calendar 2025. One of them, accession 0001140361-25-037980 filed 14 October 2025, records the board electing Ronnie A. Pruitt as the next chief executive effective 1 January 2026, with J. Thomas Hill stepping down and staying on the board as executive chairman. The other three are an incentive-plan approval in which nobody changed job, an amendment adding the incoming chief executive's pay, and a chief strategy officer's retirement notice. The index for the CEO change sits at https://www.sec.gov/Archives/edgar/data/1396009/000114036125037980/0001140361-25-037980-index.htm.
Counting those filings gives four executive changes at one company in one year, or three if amendments are dropped. Reading them gives one. The board acted on 10 October 2025 and the new chief executive took office on 1 January 2026, so the same event lands in 2025 Q4 on our convention and in 2026 Q1 on the effective-date one.
Two cautions. The bulk file is not an as-filed archive: the SEC applies post-acceptance corrections and deletions, removals processed on later business days are absent from previous indexes, and the index files are rebuilt weekly on Saturday mornings, so re-running our 2019 quarter next year can legitimately return slightly different numbers with nobody having erred. And do not keyword-classify the filings and publish the result.
Which leaves the real question. The data is free and the measurement is not, because the labour sits in defining the denominator and reading filings. An officer field needs an event trigger rather than a calendar refresh, and the licence-or-build decision comes down to whether anyone on your team will read the samples every quarter. If nobody will, the recurring half has to be somebody's job. That is the work Forage AI does for clients: standing up this kind of measurement as a pipeline against a client's own fields, on the cadence they name, with the denominator defined and the labelling done rather than asserted. One series on one population, built to a specification, and that is the whole claim.
Method, sample and limits
| Item | Value | |---|---| | Source file | SEC EDGAR bulk submissions, https://www.sec.gov/Archives/edgar/daily-index/bulkdata/submissions.zip | | Downloaded | 2026-10-14 22:41 UTC, 1,568,978,254 bytes, 988,781 CIKs | | Latest filing in the file, and the as-of date for every figure | 2026-10-13 | | Population rule | Active operating companies on a trailing-twelve-month filing rule, excluding SIC 6189 and 6770 | | Sample A | 320 filings, 40 per year 2019 to 2026 year to date, six-way labelled, seed 20261015 | | Sample B | 120 companies per year, 960 company-years, binary CEO-or-CFO flag, seed 20261016 | | Sample C | 50 companies per quarter for 8 quarters, binary flag, seed 20261017 | | Hand labels written | 2,831 | | Intervals | 95% Wilson throughout |
Six disclosures make the page auditable, and the awkward ones are here on purpose.
- The date convention is announcement, the same choice the Conference Board makes and the opposite of Crist Kolder's.
- The denominator is point-in-time, and tested. 2,518 of the 6,527 companies in the 2019 Q1 denominator have no filing after 2024 and are still counted, so the early years are not restricted to survivors. What that does not rule out is a CIK removed from EDGAR entirely, which we did not test.
- The series is as EDGAR's index stood on the pull date, not as filings stood when they were made. We keep the reduced dataset so a future re-read is a comparison rather than a replacement.
- The trend robustness check is published, not held back: filings per filing company fell 2.60 to 2.53 and 2.66 to 2.60, at r = -0.57 and -0.58 against the sampled share.
- Labelling carries a gap we cannot close. Every label was written by a person against a fixed rubric and no keyword classifier assigned any, but the annual sample has no inter-labeller check, so a small drift between years cannot be ruled out. Two quarters split across two labelling passes showed no detectable difference, p = 0.35 and p = 0.81, on 25 to 38 filings a side, which rules out a large labeller effect and not a small one.
- Universe composition cannot be tested. The filer population shrank 8.5% and the file carries no size or point-in-time attribute, so we cannot say whether the companies that stayed change officers more often than the ones that left.
A high-recall keyword screen chose which filings a person read in the annual sample. It is not a classifier and it assigned no labels. Recall against the filing-level hand labels was 78 of 80 CEO or CFO filings, 97.5%, at a screen-in rate of 75.6%, and an audit of 150 screened-out filings found one positive, 0.67%. Expected missed positives are about four, biasing the per-year rates downward by at most 0.4 percentage points.
Five figures we could not compute, listed rather than implied: separate CEO-only and CFO-only company rates, both samples carrying one combined flag; a hand-measured quarterly rate before 2024 Q4; point-in-time SIC or entity type; any figure for Public Administration, no active operating filer carrying such a code; and whether the SEC retroactively edits the items field.
Expert Insights The Conference Board describes its own figures as "a conservative measure of publicly identifiable forced succession rather than a complete measure". The same publisher states the mechanism plainly: a chief executive may be encouraged to leave privately while the transition is publicly characterised as a retirement.
Our series has the same property for the same reason. These figures count only changes disclosed in an 8-K Item 5.02, so a change disclosed only in a 10-K, a 10-Q or a proxy, or by a company that filed no 8-K, is missed. The intervals cover sampling error only, not that coverage gap and not the labelling.
Frequently asked questions
How often do US public companies change their CEO or CFO?
32.7% of active SEC-reporting operating companies in calendar 2025, on a denominator of 5,823 companies, with a 95% interval of 26.4% to 39.2% from sampling alone. Source: Forage AI computation from SEC EDGAR as of 13 October 2026.
Is CEO turnover rising?
On our measure the company-level CEO-or-CFO rate was 22.6% in 2019 and 32.7% in 2025. The 2019 against 2025 difference is significant at 5%, the linear trend across the seven years is marginal, and pooling the first three years against the last three leaves a rise that is not statistically detectable. The share of companies filing any officer-or-director disclosure did not move. We do not measure why, and we take no position on the wider labour market.
Does an 8-K Item 5.02 filing mean the CEO left?
Usually not. Of 320 filings read by a person, 36.6% were director-only, 20.9% compensation-only and 25.0% involved a CEO or CFO. Counting these filings as executive changes overstates C-suite change roughly fourfold.
Is a published turnover rate a share of companies or a count of departures?
It depends on the publisher, and most do not say. Three of the ten we checked print a company denominator. A count can set a record in a year when the rate falls.
Which companies does this rate cover: the S&P 500, the Russell 3000, or all SEC filers?
All active SEC-reporting operating companies, roughly 5,800 to 6,500 depending on the quarter, excluding securitization trusts and blank-cheque entities. Every comparator figure in circulation covers the largest 500 to 3,000 US companies instead, and SEC registrants of any size are larger and more regulated than any real prospect list.
A field where ten publishers give ten incomparable answers looks like a measurement problem. It is closer to a division of labour nobody finished. The raw material has been free for twenty-two years and the metadata already says which item a filing carries, so what was left undone is the slow part: a denominator that does not collapse to survivors, and reading the filings instead of counting them. That is where the rate, the interval, the quarterly cut and the sector cut on this page come from, and it is why the method sits beside them rather than behind a form. The next update follows the close of 2026 Q4. The re-run is an estimated 20 to 25 minutes, which is why the cadence is stated rather than promised.
Forage AI builds custom extraction and document processing against the fields and the refresh cadence a client defines. If there is a public-record measurement you need built this way rather than quoted, talk to us about the specification.
How to cite this page
- SEC EDGAR bulk submissions,
https://www.sec.gov/Archives/edgar/daily-index/bulkdata/submissions.zip, downloaded 2026-10-14, latest filing 2026-10-13. - SEC, "Accessing EDGAR Data", read 2026-10-15.
- SEC, "Exchange Act Form 8-K Compliance and Disclosure Interpretations", read 2026-10-15.
- US Bureau of Labor Statistics, Employee Tenure in 2026, released 24 September 2026. All employed wage and salary workers aged 16 and over.
- The Conference Board with ESGAUGE, CEO Succession Practices in the Russell 3000 and S&P 500: 2025 Edition, data as of 3 October 2025, published 5 November 2025.
- Crist Kolder Associates, 2026 Volatility Report, data through 31 July 2026, a 665-company portfolio.
- Spencer Stuart, S&P 1500 chief executive transitions, as of 31 December 2025.
- Russell Reynolds Associates, global chief executive turnover, full-year 2025, read 2026-10-15.
- Challenger, Gray and Christmas, chief executive exit counts, August 2026 release dated 24 September 2026, a mixed universe of public, private, government and non-profit employers.
- Equilar, departures at "Equilar 500" companies, full-year 2025, published 6 March 2026.
- Heidrick and Struggles, sitting chief executives across 28 markets, as of 5 January 2026.
- Strategy&, part of the PwC network, global chief executive succession, 2018 data published May 2019, the world's 2,500 largest companies, context only.
- Audit Analytics, part of Ideagen, Director and Officer Changes module, read 2026-10-15.
Suggested citation. Forage AI, US CEO and CFO turnover by quarter and sector, computed from SEC EDGAR Form 8-K Item 5.02 filings, data as of 13 October 2026, published 15 October 2026.
Related Articles
- B2B data decay statistics. The measured decay rates per field, and the owner of our published 27.1% annual figure.
- How to choose a B2B data provider. The selection criteria to apply once you know what a vendor's number counts.
- US business registries. Where company-level public records live outside the SEC's filing system.
Sai is a data infrastructure enthusiast who has spent the past two to three years following the AI space closely, from the infrastructure layer to the fast-growing world of data for AI. He is genuinely curious about how modern data pipelines get built and where the data industry is heading, and he writes insightful pieces on the core topics that shape this niche.