The run completed at 04:17. No errors. No timeouts. The job finished clean, the logs showed green, and the delivery landed exactly where it was supposed to. You closed your laptop.
The client flagged an issue two days later.
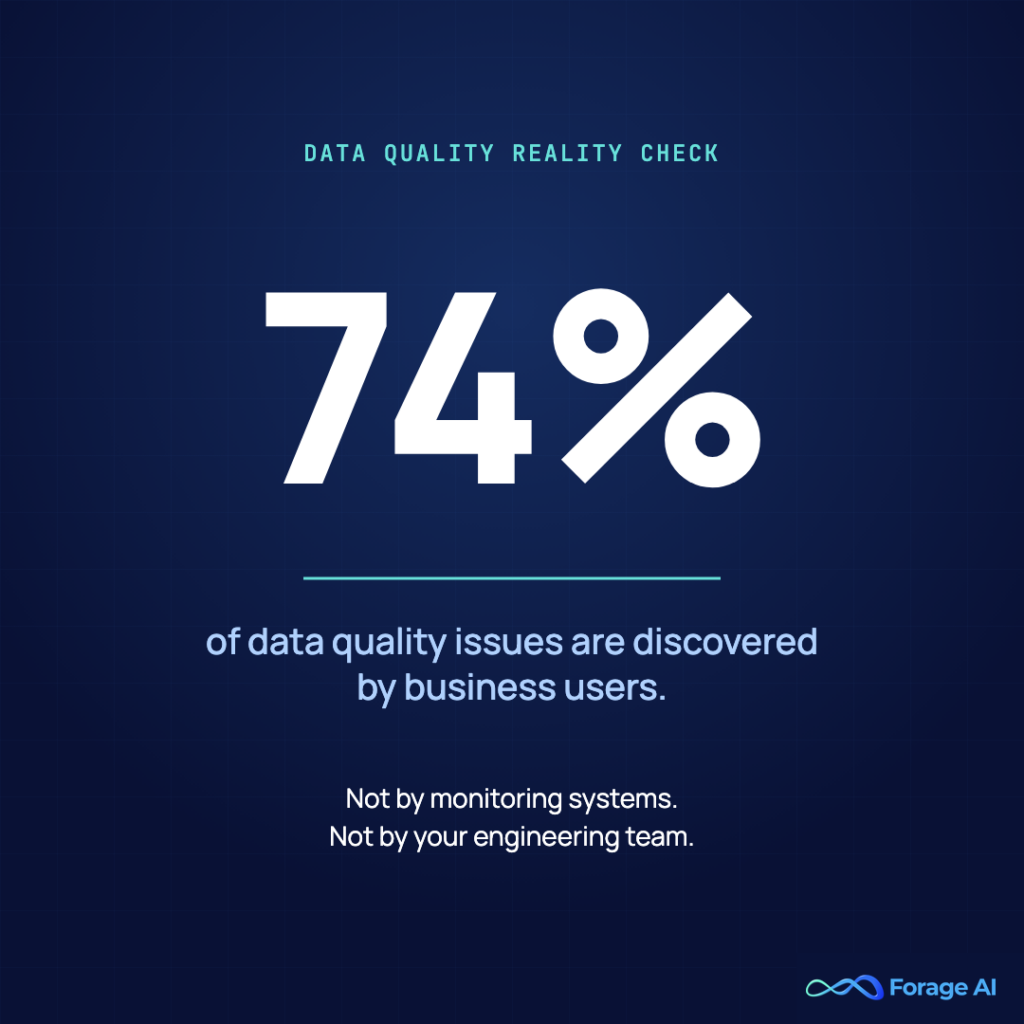
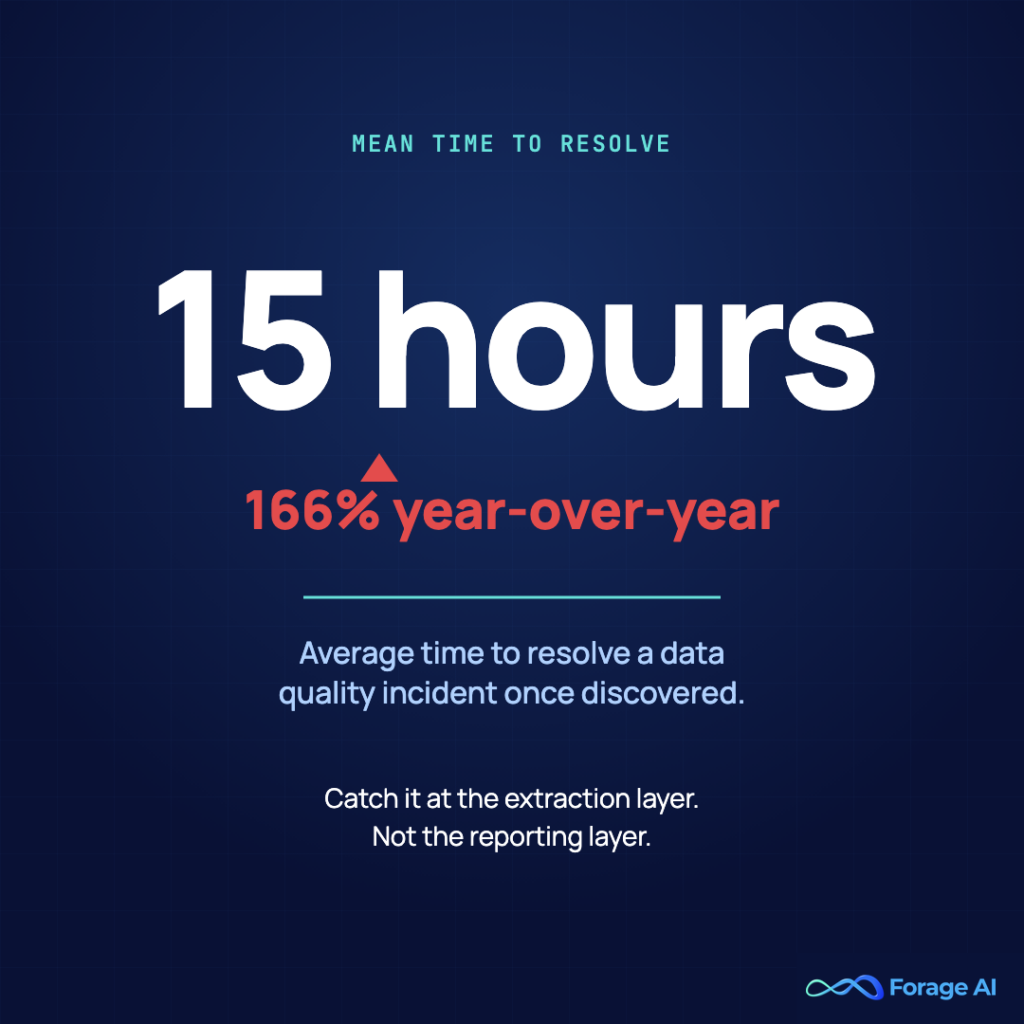
This is the pipeline failure mode that infrastructure monitoring does not catch. It is far more common than the kind that throws an error. According to a 2026 industry analysis of pipeline monitoring, 74% of data quality issues are discovered by business users or data consumers, not by monitoring systems. The average time to resolve an incident once it is discovered is 15 hours — a 166% year-over-year increase.
This article is about closing the gap between “run completed” and “data is good.” Specifically: what to watch in an extraction pipeline to catch failures before they reach the delivery layer. We’ll cover three signals that appear before a pipeline breaks, the four most common failure points with specific catch methods for each, and a case study of a date logic error that hid behind stable volumes for multiple runs before being caught pre-delivery.
Quick Digest
- Infrastructure monitoring and data quality monitoring are different layers. A pipeline completing successfully tells you the scheduler ran. It does not tell you the data is correct.
- Three signals appear before most extraction pipeline failures become visible downstream: volume deviation vs. baseline, schema inconsistencies in the output, and an increase in QA flag rate.
- Each extraction failure point has a specific catch method. Front-end structure changes need field drop monitoring. Pagination breaks need page-level distribution checks, not just total record counts. Date errors need bounded-range validation. Duplicates need composite key clustering.
- The four “silent” failure patterns — field-level corruption, null inflation, coverage erosion, and semantic inversion — bypass standard schema and null-rate checks entirely. They require distributional monitoring.
- A real case study: an event pipeline with stable volumes, start dates returning to 2015, root cause in recurring-event date logic, caught by date sanity checks before delivery.
Observability at the Extraction Layer Is Not the Same as ETL Monitoring
The five pillars of data observability — freshness, volume, schema, distribution, and lineage — were developed to monitor data inside warehouses and ETL pipelines. Applied directly to data extraction automation, they translate, but they need recalibration.
In a warehouse, schema means column definitions and data types. In an extraction pipeline, schema refers to the DOM field structure, CSS selector success rates, and whether the pattern that extracted a product title yesterday still extracts one today. In a warehouse, volume anomalies are caused by upstream ingestion failures. In an extraction pipeline, they come from target website behavior: pagination changes, A/B tests that split inventory across URL structures, or anti-bot measures serving a detection page instead of content.
That distinction matters because most data pipeline observability tooling is built for the warehouse layer. Choosing the right data observability tools for external data pipelines is what closes that gap. Apply it to the extraction layer without adaptation, and you get run-level health signals — did the job complete, did it timeout, did it throw an exception — but nothing about whether the data the job produced is correct.
EXPERT INSIGHTS
- A growing majority of data and analytics leaders have already implemented data observability solutions, according to recent Gartner survey data. The majority of that investment sits at the warehouse and ETL layer. The extraction layer remains the blind spot.
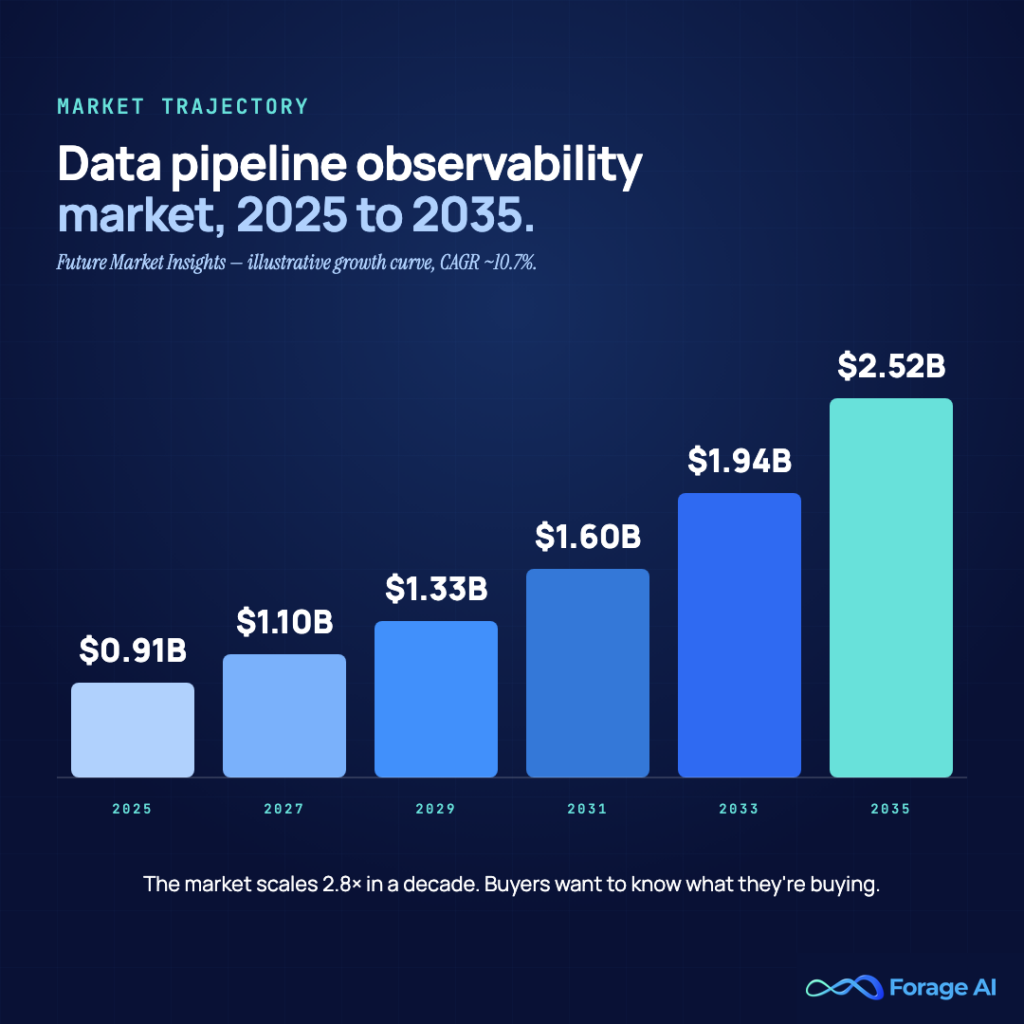
- The data pipeline observability market is growing from $912 million in 2025 to $2.5 billion by 2035 (CAGR 10.7%). Investment is accelerating, but the tooling gap at the extraction layer means teams still need to build specific checks rather than assume existing platforms cover them.
QUICK SUMMARY
- Can I apply my existing data observability stack to my scraping pipelines? You can monitor run-level health with existing tools — job completion, timeout rates, and error frequencies. Field-level extraction validation requires checks specific to how extraction fails: field completion rates, DOM structure changes, and page-level record distribution. Most warehouse-level observability tools don’t provide these natively.
- Should I treat extraction pipeline monitoring as a separate concern from ETL monitoring? Yes. The failure modes are different — driven by target website behavior rather than upstream system state — and they require different signals.
The Silent Failure Problem — Why “Run Completed” Tells You Nothing About Data Quality
Silent failures are the category where the job runs successfully, no errors are thrown, no alerts fire, but the data that lands is wrong. It is structurally valid — it passes schema checks, row counts are in range — but the values themselves have shifted or degraded.
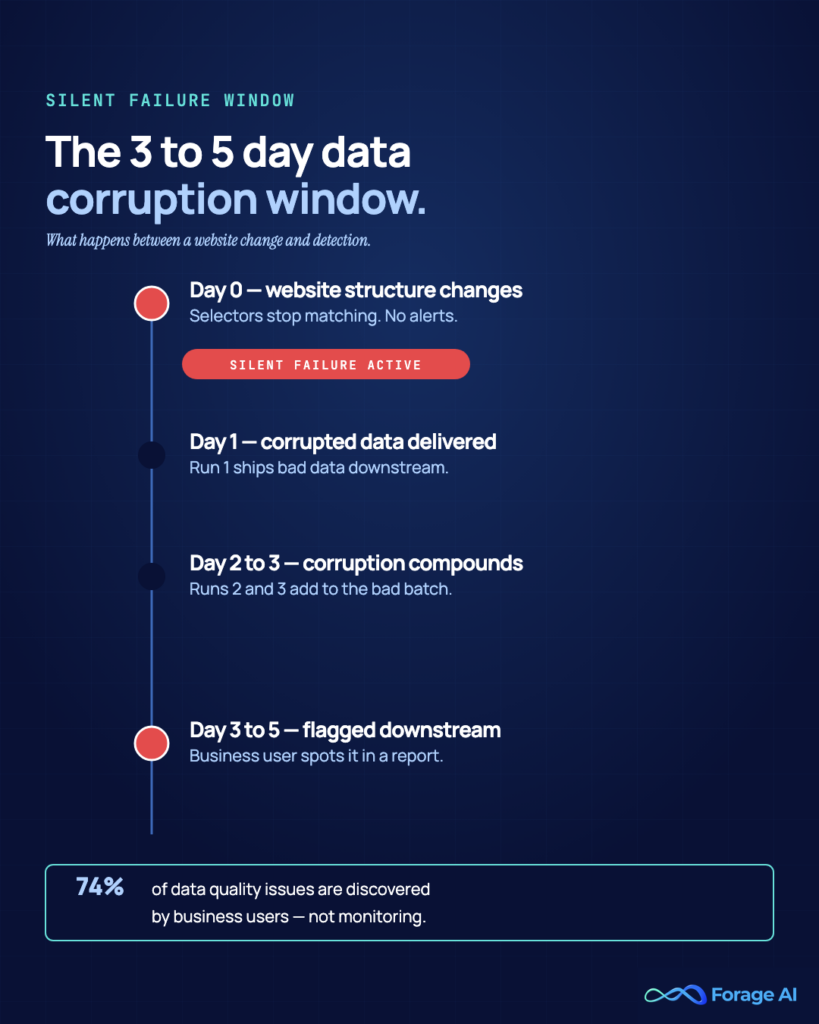
A 2026 analysis of production extraction pipelines found that infrastructure failures are typically detected within minutes. Field-level completeness failures, when not actively monitored, are typically discovered 3–5 days later through downstream reporting discrepancies. That window is not a detection lag — it is a data corruption window. Every run during that period is delivering data that the recipient cannot trust.
The mechanism is straightforward: a target website changes its structure, the scraper continues running, a field starts returning empty strings or wrong values, nothing in the infrastructure layer registers this as a failure, and downstream consumers — analysts, client-facing dashboards, models trained on the output — work from corrupted data. By the time someone notices, backfilling is required across multiple runs.
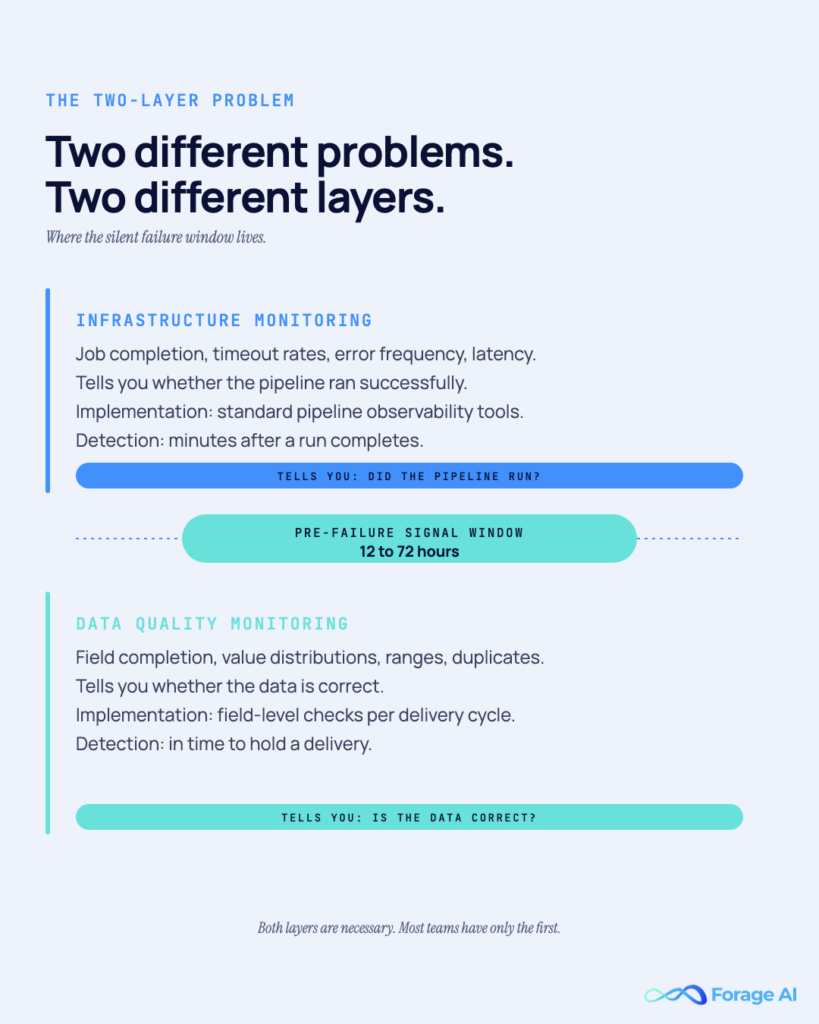
This is why the distinction between infrastructure monitoring and data quality monitoring matters in practice. Infrastructure monitoring tells you whether the pipeline ran. Data quality monitoring tells you whether the pipeline produced correct data. Both are necessary. Most extraction teams have the first; far fewer have the second.
The window between when a failure begins in the extraction layer and when it surfaces in downstream reports — typically 12 to 72 hours — is what we call the pre-failure signal window. The signals in the next section are designed to close it.
EXPERT INSIGHTS
- 74% of data quality issues are discovered by business users, not proactive monitoring (Monte Carlo 2026, n=200). For extraction pipelines, that typically means the client or an analyst is the first to notice something is wrong — not the engineering team managing the pipeline.
- The mean time to resolve a data quality incident is 15 hours, up 166% year-over-year. Catching a failure at the extraction layer instead of the reporting layer compresses the intervention window from days to hours.
QUICK SUMMARY
- Is the silent failure problem specific to scraping pipelines? No — it affects any data pipeline. But extraction pipelines are particularly exposed because the failure source is external: a website you don’t control can change structure at any time, without notice. ETL pipelines fail when upstream systems change, which you typically have some visibility into. With extraction, the upstream is the open web.
- My scraper returned 200 status codes across every request. Is the data good? Not necessarily. HTTP success codes confirm the server responded and the request wasn’t blocked. They say nothing about whether the response contained the content your selectors were targeting, whether the extracted field values are semantically correct, or whether the page served was a bot-detection interstitial.
Three Signals That Appear Before an Extraction Pipeline Breaks
Most pipeline failures don’t arrive without warning. They produce signals in the extraction output before the failure becomes visible downstream. Monitoring these signals — per source, per run — gives you the pre-failure window to intervene.
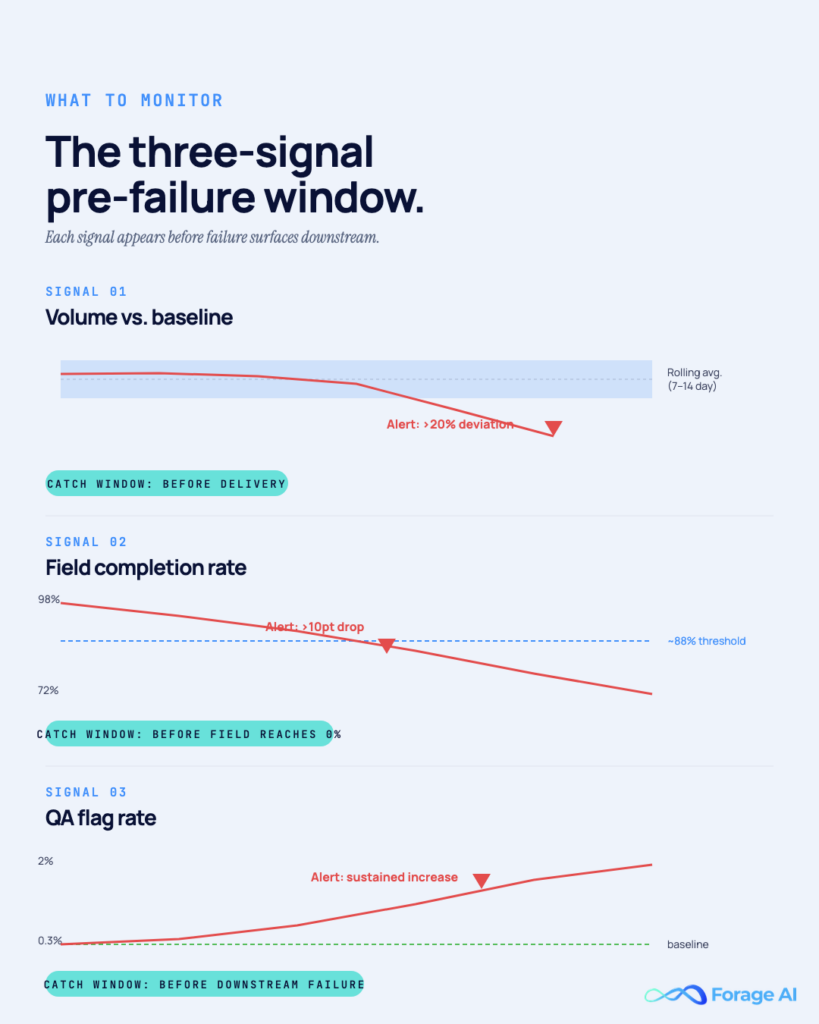
Signal 1: Volume deviation vs. baseline
The signal is not that the record count dropped. The record count dropped for a specific source compared to what that source normally produces. A source that typically returns 2,400 records dropping to 600 is a different problem than a source that normally returns 600. Static alert thresholds do not capture this distinction. Rolling baseline monitoring does.
Set a 7-to-14-day rolling average per source. Alert when any source deviates from its baseline by more than a defined percentage — typically 20% on the downside, 30% on the upside (an unexpected spike can indicate duplication as readily as an increase in actual content). This is source-level anomaly detection, not pipeline-level monitoring. A pipeline-level count can look normal while one or two sources have collapsed completely, with other sources compensating. Anomaly detection tied to rolling baselines requires approximately 40% less maintenance than custom SQL threshold monitors, and it catches deviations that static thresholds miss when source volumes naturally vary (Monte Carlo 2025).
Signal 2: Schema inconsistencies in the output
This is the signal that precedes structural failures. Watch for: required fields with a sudden increase in null or empty values, fields that previously returned typed values — numbers, structured dates — now returning plain strings, and new fields appearing in the output that weren’t defined in the schema, which can indicate the scraper is picking up content from a restructured page element.
Monitor the field completion rate for each required field across runs. Calculate the rolling average completion rate and alert when any required field drops more than a defined threshold — typically 5 to 10 percentage points — from its rolling average. A price field that was 98% populated dropping to 72% is a signal. A category field returning empty strings for a growing subset of records is a signal. These appear before the field fails entirely, and catching the trend gives you time to investigate before the run is delivered.
Signal 3: QA flag rate increase
When your QA layer — automated checks, human reviewers, or both — starts flagging records at a rate above the baseline for a given source, something has changed. The QA flag rate is a leading indicator because reviewers catch anomalies that pattern-matching checks miss: values that are syntactically correct but semantically incorrect, records that pass all validation rules but look anomalous in context.
Monitor flag rate on a rolling basis per source. A source that normally produces a 0.3% flag rate, rising to 2% across three runs, is a meaningful signal, even if no individual automated check fails. Teams that pair automated field-level checks with human QA sampling have a shorter feedback loop on this signal — the human reviewer catches what the automated check has not yet been written to catch.
EXPERT INSIGHTS
- In production pipelines, all three signals typically appear within the same run or within a sequence of two to three runs. When two or more signals fire together — volume drop and field completion decline on the same source — treat that as a high-confidence failure indicator, not a coincidence. Escalate to manual QA review before delivery.
- Alert engagement drops approximately 15% when a notification channel receives more than 50 alerts per week, and an additional 20% when it receives more than 100 alerts per week (Monte Carlo 2025). The three signals above are designed to fire infrequently and specifically — not on every fluctuation. Threshold calibration is part of the implementation, not a one-time default.
QUICK SUMMARY
- How do I distinguish a real signal from normal source variation? Baseline-based thresholds, not static ones. A source that normally varies between 1,800 and 2,200 records should have thresholds set relative to that range — not at an absolute number like 1,500. Build in two to three weeks of run history before trusting your baselines.
- Do all three signals require separate monitoring systems? No. Volume deviation and field completion rate can be measured directly from the extraction output — you don’t need a separate tool. QA flag rate requires a QA layer, automated or human, that records flag counts per source per run. Most production extraction teams already have the underlying data; the gap is aggregating it into a monitoring view.
The Four Failure Points in Extraction Pipelines — And the Specific Checks That Catch Them
The three signals tell you something has changed. The four failure points below tell you what. Each has a distinct mechanism and a specific detection approach.
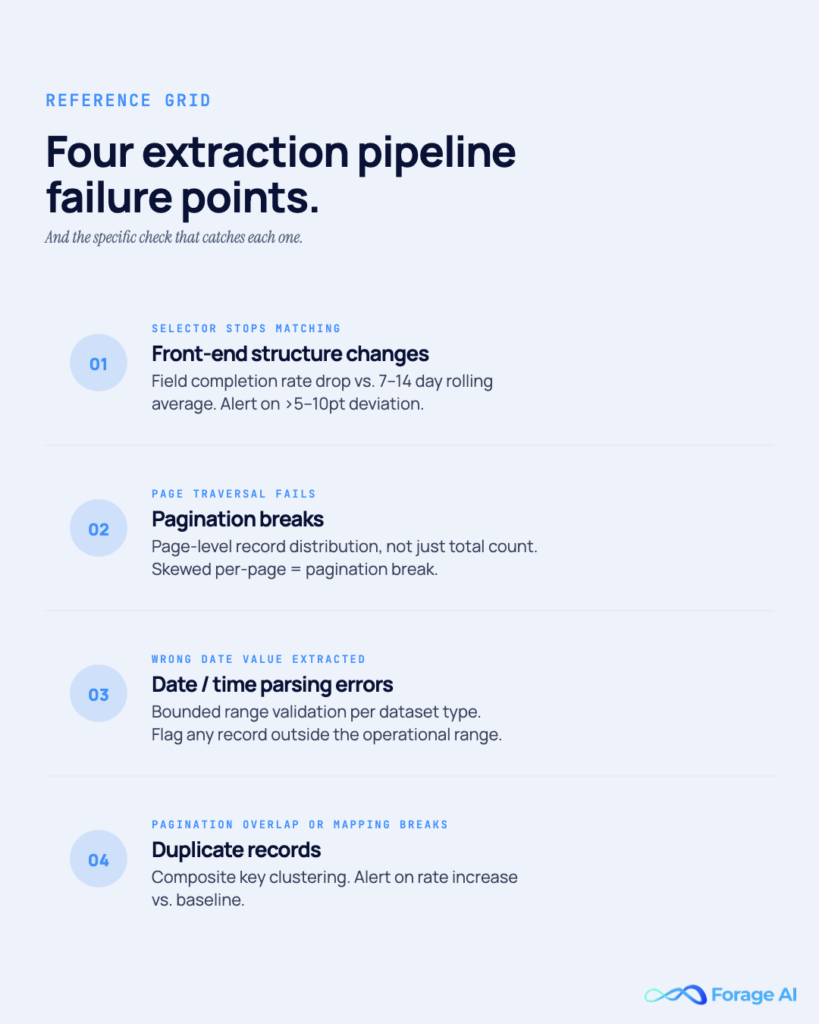
Front-End Structure Changes
When a target website redesigns its front-end — renaming CSS classes, restructuring containers, converting numeric fields to formatted strings — the scraper continues running. Rows are still produced. Nothing crashes. What happens instead: field completion rate drops for one or more critical fields as the selectors stop matching the restructured elements.
The catch method: Monitor field completion rate per required field on every run. Set a rolling average and alert when any required field drops more than a defined threshold — typically 5 to 10 percentage points — from that average. When the alert fires, trigger a QA sampling review of the affected records before the run is delivered.
The mistake teams make here is waiting for the field to reach 0% before investigating. By that point, multiple runs have been delivered with corrupted data. The trend is the signal — catch it on the way down, not at the bottom.
Pagination Breaks
Pagination failures produce two patterns. The obvious one: total record count drops because the scraper stopped traversing after page 1. The dangerous one: page-level record distribution becomes skewed — page 1 returns normal volume, pages 2 and beyond return near-zero, and the total count looks close to normal because page 1 compensates.
The catch method: Monitor page-level record distribution, not just total count. If a source typically produces 200 records per page across 12 pages, and page 1 suddenly produces 1,800 while pages 2 through 12 produce fewer than 5 each, the total is close to normal, but you have delivered one page of data and missed eleven.
This matters because target websites frequently change pagination implementations: offset-to-cursor transitions, URL structure changes, and infinite scroll replacing paginated pages. Total record counts mask the distribution problem until a downstream analysis surfaces the gap.
Date and Time Parsing Errors
Date errors are among the hardest failures to catch with standard schema checks because the field is populated and correctly typed. The scraper is capturing a date value — just not the right one. The most common pattern: a date field that should contain a forward-looking date instead contains a historical one, often because the scraper is pulling the first available backend date rather than the contextually correct occurrence.
The catch method: Outlier detection on date fields using bounded expected ranges. For a forward-looking event feed, no date should fall more than 90 days in the past or more than two years in the future. Any record outside that range is a candidate for manual review before delivery. Set the range per dataset type — event data, real estate listings, job postings, and delivery windows each have different defensible bounds.
Standard schema validation does not catch this. A date field containing an ISO 8601-formatted value passes a type check regardless of whether the date makes logical sense for the use case.
Duplicate Records and Mapping Issues
Duplicates enter extraction pipelines through three mechanisms: pagination overlap (the same record appears on two pages in the source), endpoint restructuring (a website update changes URLs while the underlying records remain the same, so both old and new URL content is extracted), and mapping logic that breaks when a source updates its internal ID scheme.
The catch method: Cluster records by composite key — a combination of fields that should uniquely identify a record for that dataset type. For event data: title + location + date. For business directory data: name, address, and phone number. For product data: SKU or product name + brand. Monitor duplicate rate against baseline. When QA flags start accumulating on near-identical records, treat that as a leading indicator before the duplicate rate becomes systemic.
Deduplication after delivery is expensive and introduces its own error risk. Catch it at the extraction layer, before delivery.
EXPERT INSIGHTS
- Schema drift accounts for 7.8% of root causes of poor data quality across all pipeline types — but in extraction pipelines, it is more frequent than that aggregate suggests, because the failure source is external and uncontrolled. A single website redesign can break field extraction across thousands of records simultaneously (Monte Carlo 2025).
- The defining characteristic of all four failure points above: the pipeline appears to be working because it is — the infrastructure ran correctly. The failure lives in the data layer, not the execution layer, which is why execution-layer monitoring cannot detect it.
QUICK SUMMARY
- Which of the four failure points is most common in long-running pipelines? Front-end structure changes are the most frequent — websites are redesigned continuously, and class renames and container restructuring are routine. Date parsing errors are less frequent but harder to detect without explicit range checks, which means they tend to stay in production longer before someone catches them.
- Do all four require separate monitoring implementations? No. Volume baseline monitoring catches pagination breaks. Field completion rate monitoring catches front-end structure changes. Date range validation is a dedicated check, but straightforward to build. Composite key deduplication is a post-extraction step that runs before delivery. All four can be implemented as part of a single pre-delivery validation pass.
Beyond Null Counts — Four Field-Level Failure Patterns That Don’t Show Up in Error Logs
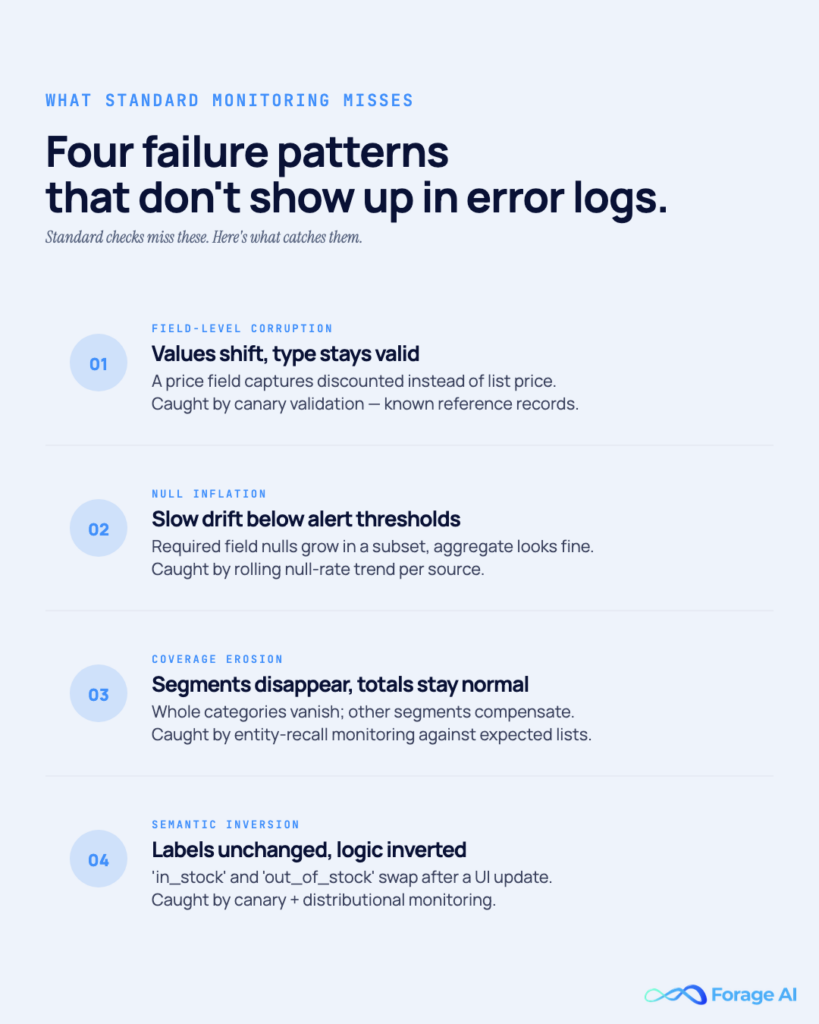
Standard monitoring catches two categories of failure: records that fail schema checks, and records with null values in required fields. The four patterns below bypass both.
Field-level corruption is when a field continues to populate — maintaining its completion rate and type — but shifts what it captures. A price field that previously captured the list price starts capturing the discounted price after a website restructures its product page layout. A product title field starts capturing category names because a layout change repositioned the category element above the title element in the DOM. The field is populated. The type is correct. The value is wrong.
Null inflation occurs when required attributes are missing in a growing subset of records, while the majority continue to be populated correctly. The overall null rate for the field stays low enough to avoid triggering an alert, but the affected subset is growing. By the time the null rate crosses the alert threshold, the failure has been in production for multiple runs.
Coverage erosion is when entire segments of the target dataset disappear from the output while total row counts remain stable. A product category stops appearing in extraction results — not because records for that category have null fields, but because the website’s navigation or URL structure changed and the category is no longer being crawled. Other categories compensate in total count. The category is simply gone.
Semantic inversion is the most subtle: a label retains its name but reverses its meaning. An availability state field labeled “in_stock” and “out_of_stock” starts labeling them in reverse after a front-end update changes how those states are rendered. Both values are valid strings. The logic is inverted.
Catching these four patterns requires distributional monitoring: tracking the percentage frequency of each value in key categorical and structured fields — availability states, categories, price ranges, labels — across runs, and alerting when any value’s frequency shifts by more than a defined threshold from its rolling average. For coverage erosion specifically, entity recall monitoring — tracking which expected categories, brands, or segments appear in each run — is more sensitive than aggregate record counts. In practice, this means maintaining a reference list of expected entities per source and checking each run’s output against it.
For field-level corruption and semantic inversion, the most reliable catch method is canary validation: maintain a small reference set of records per source — 10 to 20 records with known expected field values — and run extraction against them on every delivery cycle. When canary output diverges from expected values, a structural or logical change has occurred in the source.
EXPERT INSIGHTS
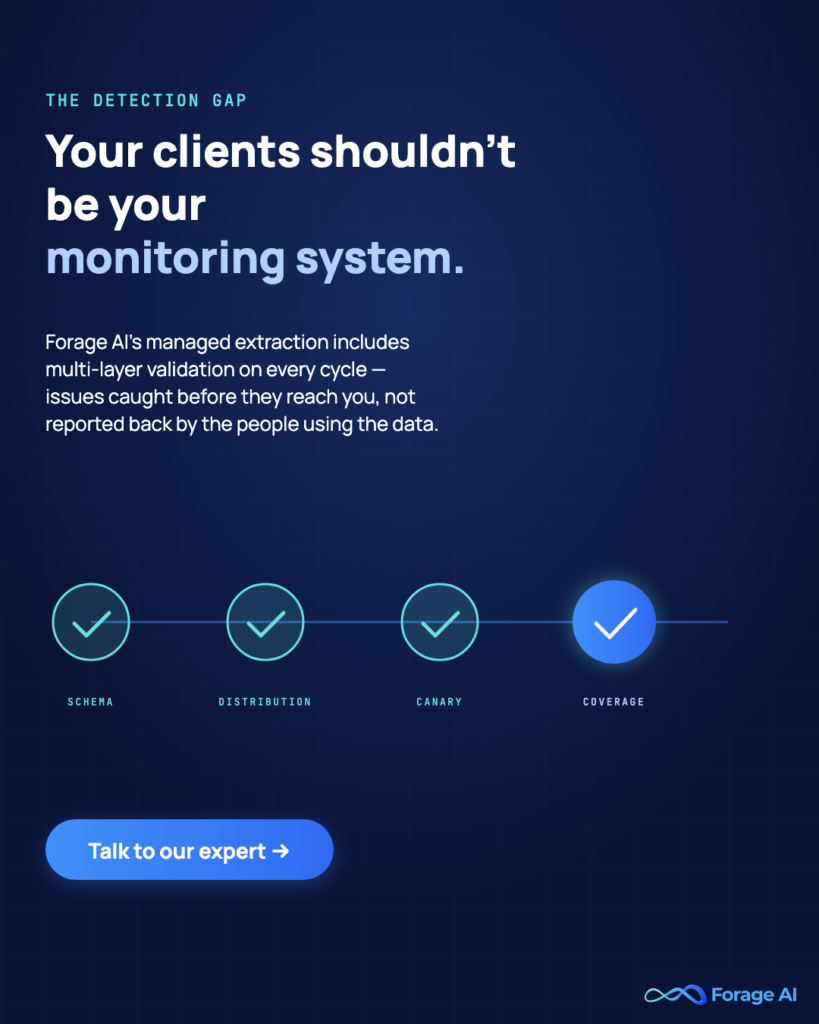
- A four-layer validation framework for extraction pipelines addresses these patterns progressively: structural integrity (schema, selector success rates), distributional drift (univariate statistics across field values, multivariate relationship tracking), coverage and representativeness (entity recall across expected categories and segments), and canary validation (stable reference records with known expected outputs tested on every run). The canary layer is the most direct way to catch field-level corruption and semantic inversion before they propagate into delivered data.
- 40% of data professionals’ time is spent addressing data quality issues rather than using data (2026). For extraction teams, undetected field-level corruption compounds: each delivered run requires retroactive correction, and the cost to the client relationship is separate from the engineering cost.
QUICK SUMMARY
- My null rate monitoring is clean — is that sufficient? No. All four patterns above can occur with zero null rate impact. Field-level corruption, coverage erosion, and semantic inversion produce wrong values, not missing ones. Distributional monitoring — value frequency tracking over time — is a separate and necessary layer.
- Is Canary validation practical at scale? Yes. The reference set does not scale with source count. Maintain 10 to 20 reference records per source with known expected field values, and test each run’s output against them. The computational cost is low; the detection value for field-level corruption and semantic inversion is high.
Case Study — When Stable Volumes Hid a Date Logic Error
This is the failure mode that combines everything in the previous sections: infrastructure success, stable volumes, passing schema checks, and completely wrong data.
The pipeline was managing event aggregation — pulling upcoming event data from multiple sources, normalizing it, and delivering a forward-looking event feed. By every observable metric, the pipeline was healthy. Volumes were consistently run over. Field completion rates were normal. No alerts had fired.
A QA sampling pass flagged an anomaly: a subset of event records had start dates as far back as 2015. Not occasional outliers — a consistent, reproducible subset that appeared across multiple runs, with dates that had no business appearing in a feed of upcoming events.
The investigation traced the root cause to the recurring-event scraper. For recurring events — events that happen weekly, monthly, or annually — source websites store the history of all occurrences, not just the next one. The scraper was pulling the earliest available backend date for each recurring event: the date of the first occurrence in the system’s history. For events that had been running for several years, that meant start dates in 2015 and 2016.
The infrastructure reported success on every run. The field was populated. The type was correct. The logic — which dates value to extract from a recurring event’s date structure — was wrong.
What caught it: Date sanity checks on the start date field, combined with QA sampling. Date range validation flagged any record with a start date beyond the defined operational bounds as a candidate for review. On a feed of upcoming events, that rule should never fire for a correctly extracted record. It fired for the entire recurring-event subset.
How it was resolved: The historical delivery file was held back from the client. Date extraction logic was updated to target the next occurrence date for recurring events, with separate logic defined for multi-day events — where the start date is the first day of the series, not a historical occurrence. A proactive communication to the client explained the correction scope: the events affected, the runs involved, and the updated extraction logic going forward.
The lesson this case demonstrates: The failure was not technical. The scraper ran correctly — it was extracting a date field that existed in the source. The failure was in the logic of which value to extract, a decision the scraper consistently made incorrectly across every affected run. Run-level monitoring cannot detect this class of error. Only field-level validation with domain-appropriate range bounds closes this gap.
EXPERT INSIGHTS
- The event aggregator case is representative of a broader pattern in recurring or structured datasets: fields that have multiple valid values in the source — first occurrence, next occurrence, most recent occurrence — where the which is as important as the what. Date fields in event, appointment, and booking data are the most common instance, but the same pattern appears in version fields, price fields with historical and current values, and availability fields that encode state history.
- Proactive client communication when a data error is caught before delivery consistently builds more trust than silent correction after the fact. The client learns that this team found a problem and fixed it before it reached them. That is the kind of pipeline reliability that drives long-term account relationships.
QUICK SUMMARY
- How often does this type of logical date error occur in practice? In datasets with recurring or multi-occurrence records — event data, appointment data, subscription renewal dates — more often than teams expect. The failure mode is specific to how date fields are structured in source systems, and it is invisible to anyone not actively running date range validation.
- Could this have been caught on the first affected run? Yes. Date range validation running from the first delivery run would have flagged the affected records immediately. The delay in discovery was directly proportional to how long the pipeline had been running without that specific check in place.
Building a Pre-Failure Monitoring Checklist for Your Extraction Pipeline
The signals and failure points in this article translate into a per-run monitoring discipline. Not a one-time configuration. Source websites change, baseline volumes shift seasonally, and threshold calibration needs to evolve with the pipeline.
Before the Run
Confirm that the baseline data for each active source is up to date. If a source has been inactive for more than 2 weeks, its baseline needs to be rebuilt before deviation thresholds are meaningful. Verify that required field definitions are current — if the source was recently updated by design, the field schema may have changed intentionally. Check that the date range bounds remain appropriate for the dataset type; if the client’s use case has shifted, the sanity-check bounds need updating.
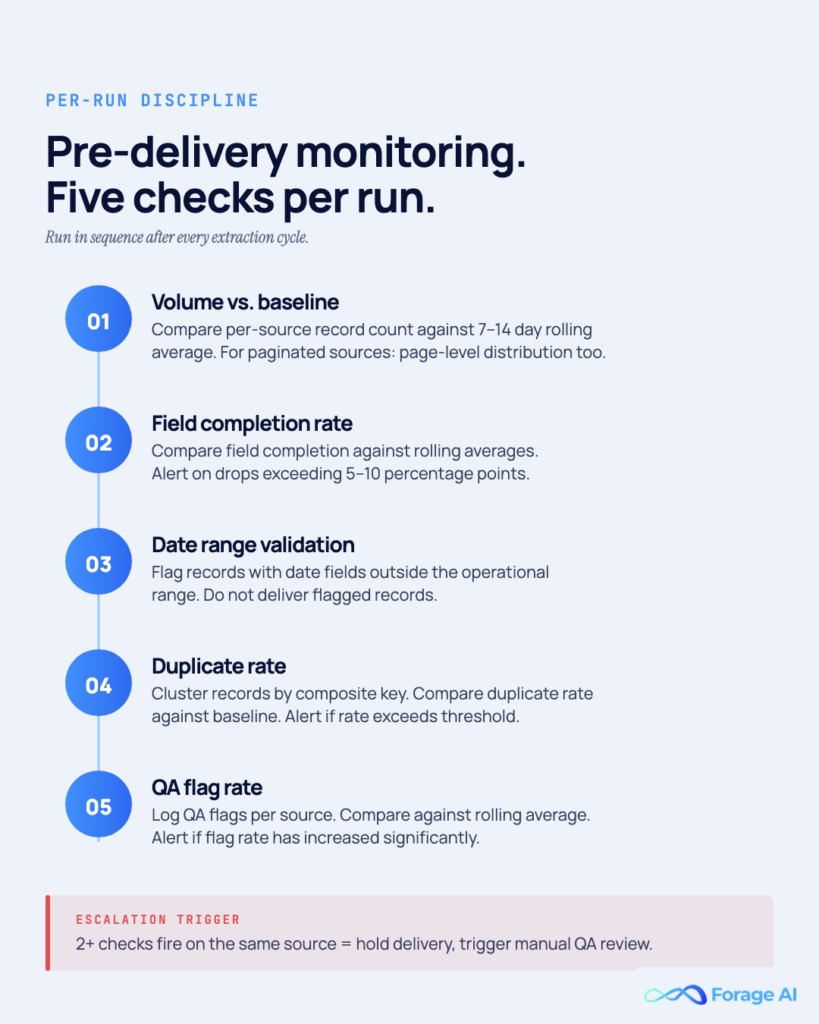
During and After the Run
Run the following checks in sequence after each extraction cycle:
- Volume vs. baseline — Compare record count per source against the 7-to-14-day rolling average. Flag any source with a deviation exceeding the threshold. For paginated sources, check page-level distribution — a normal total with a skewed per-page distribution is a pagination break signal.
- Field completion rate — Compare completion rate for all required fields against their rolling averages. Alert on any field that drops more than the defined threshold from its rolling average.
- Date range validation — Flag any records with date fields outside the defined operational range for that dataset. Do not deliver flagged records without manual review.
- Duplicate rate — Cluster by composite key and compare the duplicate rate against baseline. Alert if the rate exceeds the defined threshold.
- QA flag rate — Log the number of QA flags per source for the run and compare against the rolling average. Alert if the flag rate has increased significantly.
Escalation Protocol
If two or more checks flag the same source in the same run, treat it as a high-confidence failure signal. Trigger a manual QA review of the affected source before delivery. If delivery cannot be held, flag the affected records in the delivery file and communicate the issue proactively to the recipient.
If a single check fires consistently across three or more consecutive runs for the same source, investigate whether the threshold needs recalibration — the source’s normal behavior may have shifted — or whether there is an ongoing extraction issue that has not been resolved.
Teams that operate extraction pipelines under a managed delivery model — typical of mature data extraction services, where pipeline ownership, QA, and delivery accountability sit with the extraction team rather than the data consumer — run these checks as a standard part of every delivery cycle. 67% of data teams that implement observability report a 50% or greater reduction in mean time to resolution for data quality incidents (New Relic 2026).
EXPERT INSIGHTS
- Gartner estimates poor data quality costs organizations $12.9 million annually. For extraction pipelines specifically, that cost is not uniformly distributed — it clusters at the delivery layer: analysts working from corrupted data, clients making decisions on stale or misaligned records, and engineers spending unplanned time on retroactive backfilling.
- Baseline maintenance is where teams most consistently underinvest. A baseline built on three weeks of run data in January may be meaningless by March if the source’s content volume has seasonally shifted. Schedule baseline reviews quarterly at a minimum — more frequently for sources with known seasonal variation or high structural update frequency.
QUICK SUMMARY
- How long does it take to implement this monitoring protocol? For a pipeline already logging at the run level, moving to field-level logging typically requires one to two weeks of engineering work. The baseline period — two to three weeks of run data per source — adds time before thresholds are reliable. Expect four to six weeks from the start of implementation to a calibrated monitoring layer.
- Is this worth building in-house, or is there a case for outsourcing? If extraction pipeline management is a core engineering function — you own dozens or hundreds of sources — building the monitoring infrastructure in-house is justified. If extraction is supporting infrastructure rather than the core engineering focus, a managed extraction partner that runs these checks as a standard part of its delivery model eliminates the build and maintenance burden. The monitoring discipline is not optional either way; the question is who owns it.
Conclusion
The goal of data pipeline observability in an extraction context is not to build a better alarm system. It is to close the window between when a failure begins in the extraction layer and when it surfaces in a client report or downstream system.
The three pre-failure signals give you that window. The four catch methods give you specificity: you are not looking for something wrong in general — you are looking for a field completion drop, a skewed page distribution, a date outside its expected range, or a composite key collision rate above baseline. The four silent failure patterns remind you that the signals above do not catch everything, and that distributional monitoring is a separate and necessary layer.
If your extraction pipeline monitoring stops at “did the job complete?”, you are measuring scheduler health. The data question is separate; it requires field-level answers, and the cost of not asking it shows up days later — in a client email, not in your logs. Observability is what turns automated data collection from a scheduled job into a delivery system you can actually trust.
FAQ
What’s the difference between data observability and data quality monitoring in an extraction pipeline?
Data observability is the practice of continuous measurement and visibility into pipeline health across all dimensions. Data quality is the property you are trying to maintain, and a data quality framework defines the dimensions you measure against. You build observability infrastructure to find data quality problems. In an extraction pipeline, observability includes run-level health monitoring (job completion, error rates, latency) and field-level data quality monitoring (completion rates, value distributions, date ranges, duplicate rates). Both are needed; they are not substitutes for each other.
My scraper finished without errors — does that mean the data is good?
No. HTTP success codes and clean job logs confirm that the infrastructure ran without encountering connection or parsing exceptions. They do not confirm that the fields contain correct values, that the selectors target the correct elements, or that the extraction logic applies to the correct page structure. The absence of errors is necessary but not sufficient for data quality.
How do I detect schema drift in a scraping pipeline?
Monitor field completion rates per required field across runs and compare them against a rolling-average baseline. When a CSS class is renamed or a container is restructured, the selector that targeted that element stops matching, and the field’s completion rate drops. DOM fingerprinting — comparing the structural signature of key page elements across runs — is a more proactive approach: it detects structural changes before they affect field completion rates, giving you an earlier intervention point.
How do I set volume thresholds without generating alert fatigue?
Use rolling baselines, not static thresholds. A source that normally produces between 1,800 and 2,200 records should have its alert thresholds set relative to that range, not at an absolute number like 1,500. Static thresholds calibrated to a period of normal volume generate false positives when source volume naturally shifts. Baseline-based thresholds adapt to normal variation and alert specifically on deviation from it.
What is a pagination break, and what’s the best early signal for catching one?
A pagination break occurs when the scraper’s traversal logic stops working correctly — typically because the target website changed from offset-based to cursor-based pagination, the URL structure changed, or the scraper hits an infinite loop on the last page. The early signal is not total record count dropping — it is page-level record distribution becoming skewed: page 1 returns normal volume, subsequent pages return near-zero. Monitor per-page record counts, not just totals.
How frequently should I review and update my monitoring baselines?
Quarterly at minimum — more frequently for sources with known seasonal variation or high update frequency. A baseline built in January may be inaccurate by March if the source’s content volume shifts. For sources that have recently undergone structural changes, even if the scraper has adapted, reset the baseline to the post-change period before trusting deviation alerts again.
Related Articles
- Why Most Enterprise Data Pipelines Break and How to Fix It — The post-failure complement to this guide: once a failure has been identified, this article covers diagnosis and remediation
Sai is a data infrastructure enthusiast who has spent the past two to three years following the AI space closely, from the infrastructure layer to the fast-growing world of data for AI. He is genuinely curious about how modern data pipelines get built and where the data industry is heading, and he writes insightful pieces on the core topics that shape this niche.