
Data Quality Dimensions: How to Measure Accuracy, Completeness and Freshness
The job ran green. The row count matched last week. Then an analyst opened the report next to the website and wrote a complaint every data team recognises: "Incorrect sku count on report vs website." That line comes from a 2023 Capterra review of a managed scraping vendor, and the reviewer still gave the service four stars. Wrong data rarely feels like an outage. It feels like weather.
Most guides to data quality dimensions stop at a list of six definitions. That is the easy half. The hard half is measuring them on data you did not create and cannot see at the source.
This guide takes the three dimensions that break most often on external data: accuracy, completeness and freshness. For each one you get a definition you can compute, the way the number misleads, a check that works without ground truth, and a real team that measures it. By the end you should be able to put a number on each dimension, set thresholds per field, and ask a data supplier for evidence instead of assurances.
- World-facing dimensions: accuracy, completeness and freshness need a comparison with the outside world, so pipeline checks such as run success and schema validation cannot measure them.
- Accuracy: re-check a sample against the source with a stated size. Catching a 1% error rate at 95% confidence takes 299 records, not 20.
- Completeness: report recall against a list of what should exist, not only the share of filled fields. A table can be 100% filled and still miss whole categories.
- Freshness: measure the age of each record since it was last verified, not the time the table was loaded, and set the refresh cadence per field.
What are data quality dimensions?
A data quality dimension is one measurable property of whether data is fit for the job it has to do. The DAMA UK working group's 2013 white paper on the six primary dimensions names completeness, uniqueness, timeliness, validity, accuracy and consistency. That list is the one most articles repeat.
It is not the only list. ISO/IEC 25012 defines 15 data quality characteristics. DAMA NL's 2020 research paper catalogued 60 dimensions. Wang and Strong's 1996 study of data consumers started from 179 attributes and grouped them into 15 dimensions. The count is a modelling choice, not a fact about data. A longer list does not make your data better.
The more useful split is by what each dimension is checked against.
| Dimension | Question it answers | Checked against |
|---|---|---|
| Validity | Does the value follow the format and rules? | Your own rules |
| Uniqueness | Is each entity recorded once? | Your own data |
| Consistency | Do related values agree across tables and systems? | Your own data |
| Accuracy | Does the value match the real-world thing? | The outside world |
| Completeness | Is every expected record and field present? | The outside world |
| Timeliness (freshness) | Is the value current enough for the decision? | The outside world |
The first three are rule-facing. You can enforce them in code inside the pipeline. The last three are world-facing, and that is why they fail quietly on external data: a well-formed postcode passes validity and can still be the wrong postcode. If your data arrives from someone else's website or a vendor, the world-facing three are where your blind spots sit. For the full six-dimension framework, including the validation workflow and checklist, see our data quality framework for external sources.
How to measure data accuracy
The first world-facing dimension is accuracy. Accuracy is the degree to which data correctly describes the real-world object or event it represents. Measure it per field, not per table: a product feed can have perfect SKUs and wrong prices, and a table-level score hides which one is broken.
The formula is plain. Accuracy for a field = values that match the source ÷ values checked. The hard part is the denominator. You check a sample, so the sample size decides what error rate you can see.
Here is how it works in practice. The rule of three from a 1983 JAMA paper by Hanley and Lippman-Hand says that if you check n records and find zero errors, the true error rate is at most about 3/n at 95% confidence. The exact form gives the number of records you need before a clean sample means anything.
Python: how many records to check before a clean sample means anything
import math

def records_to_check(error_rate, confidence=0.95):
    """Records to sample so that zero errors rules out this error rate."""
    return math.ceil(math.log(1 - confidence) / math.log(1 - error_rate))

for p in (0.05, 0.02, 0.01):
    print(f"{p:.0%} error rate -> check {records_to_check(p)} records")
# 5% -> 59, 2% -> 149, 1% -> 299
A team that spot-checks 20 rows by eye can catch a broken selector. It cannot see a 1% drift. Be honest about which one your QA plan is designed to find.
For the check itself, adapt the Friday Afternoon Measurement that Nagle, Redman and Sammon described in Harvard Business Review in 2017: take the last 100 records, mark every critical field that is wrong, and count the records with no errors. Across 75 executives who ran it, only 3% of scores met even the loosest acceptable standard, and on average 47% of newly created records had at least one critical error. Those figures are from 2017, but the method has not aged. For external data, "mark the errors" means opening the source page for each sampled record and comparing field by field. If you cannot reach the source, compare against a second independent source and treat every disagreement as a review queue, not a verdict.
Two shortcuts fail here. The first is schema validation. A 2026 benchmark of 21 models found near-perfect schema compliance alongside a best exact-value accuracy of 83.0% on text and 67.2% on images. Valid JSON is not correct JSON.
83.0%: the best exact-value accuracy any of 21 models reached on text extraction, while schema compliance was near-perfect (Structured Output Benchmark, April 2026). The second is re-running the job and comparing. One test of 1,000 identical requests to a language model at temperature zero produced 80 different outputs, so agreement between two runs does not even prove stability.
LinkedIn learned the cost of skipping value checks in 2018, when incorrect data reached its job recommendations and job views dropped by 40 to 60%. The team built Data Sentinel, which turns declarative data checks into SQL that runs on Spark. The lesson travels: write the accuracy check down as code, or it will not run on the day it matters.
The downstream cost is why this is worth the effort. Wrong values rarely stop anything. They get absorbed.
"The reason bad data costs so much is that decision-makers, managers, knowledge workers, data scientists, and others must accommodate it in their everyday work. And doing so is both time-consuming and expensive."
Thomas C. Redman, writing in Harvard Business Review (2016)
For review queues where a person confirms each flagged value, see how human-in-the-loop extraction is set up.

How to measure data completeness
Accuracy tells you whether the records you have are right. Completeness asks about the records you do not have, and it has two numbers, and most teams track only one. ISO/IEC 25012 defines completeness as data having values for all expected attributes and related entity instances. The first half is fields. The second half is records.
Fill rate is the share of rows where a field has a real value. Count empty strings as missing, because scraped text often arrives as "" rather than NULL. The Great Expectations documentation says it directly: empty strings do not count as null unless they have been coerced to a null type. Its mostly parameter lets a check pass at a stated fraction, which is how you encode "price may be missing on at most 2% of rows".
Recall is the share of records that should exist and do. It needs a register, a list of what exists: a sitemap, a directory, the source's own listing count, or last quarter's reconciled universe. A partial register is still useful. Uber's data quality platform, UDQ, defines completeness this way, as a row completeness percentage computed against the upstream dataset.
SQL: fill rate per field and recall against a register
-- Fill rate per text field: NULL and empty string both count as missing
SELECT
  COUNT(*) AS rows_delivered,
  AVG(CASE WHEN NULLIF(TRIM(sku), '') IS NULL THEN 0.0 ELSE 1.0 END)          AS sku_fill_rate,
  AVG(CASE WHEN NULLIF(TRIM(product_name), '') IS NULL THEN 0.0 ELSE 1.0 END) AS name_fill_rate
FROM delivered_products;

-- Recall against a register (e.g. SKUs listed in the source's sitemap)
SELECT
  COUNT(DISTINCT d.sku) * 1.0 / COUNT(DISTINCT r.sku) AS recall
FROM register r
LEFT JOIN delivered_products d ON d.sku = r.sku;
100% fill rate is not completeness. A table can have every field filled and still be missing a whole category of records.
Row counts hide the same failure. A category that drops out while another grows nets to a flat total, and the dashboard stays green.
Timing is a completeness loss too. In a 2023 study that compared scrapes against the platform operator's own records, a scraper running 10 minutes after items were published missed 2.1% of them, and at an eight-hour lag it missed 5.4%. The same study ran two scrapers in parallel that differed only in the browser named in the request header, and they overlapped on 70.3% of the population. Two competent collectors can return different datasets from the same website at the same moment.
Delivery format can also erase completeness. CSV has no way to tell NULL from an empty string, so a missing value and a blank one become the same after a round-trip. That is one reason to weigh the delivery format choice early. Store "not found" as NULL, never as FALSE, or your model learns your collector's blind spots as facts.
If no register exists, do not report a recall number. Report a coverage estimate and the method behind it.
How do you measure data freshness?
Completeness and freshness meet at one point: a record that arrives late was missing when someone needed it. Freshness is how old a value is right now. Timeliness, in the DAMA UK definition, is whether data represents reality from the required point in time, which is freshness judged against a need. ISO/IEC 25012 calls the same idea currentness. The terms overlap, and sources disagree on where one ends. The measurement does not change: know the age of each value, and know how old it is allowed to be.
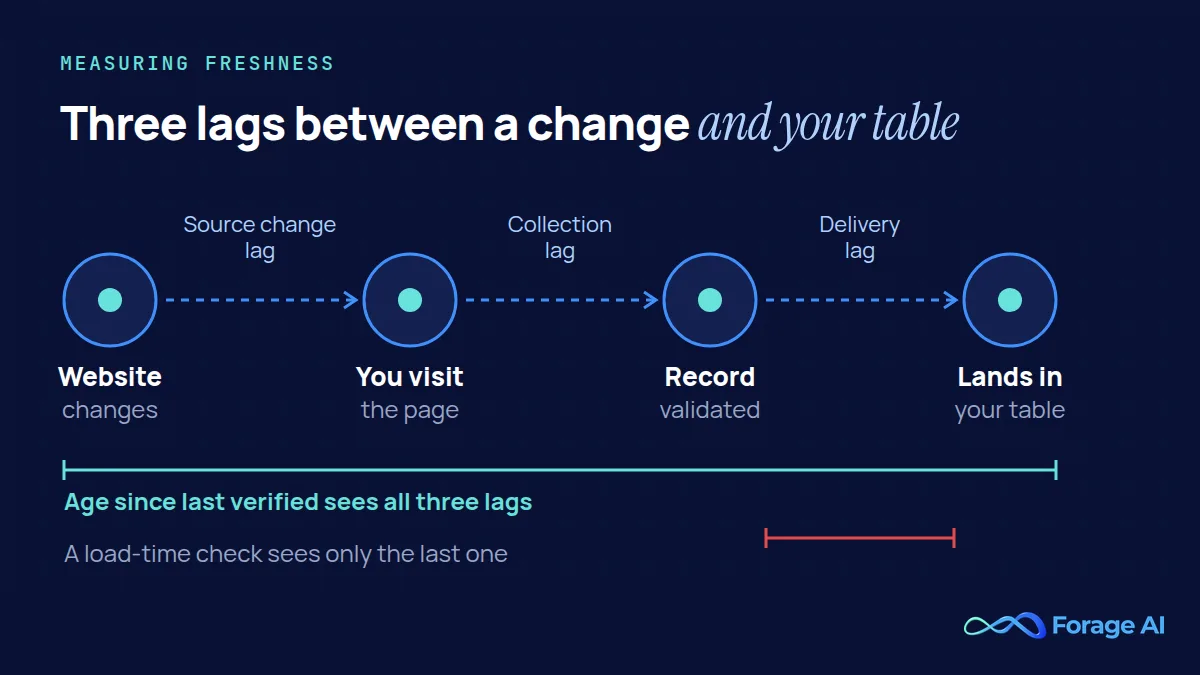
The age that matters is the age of the fact, not the age of the load. External data carries three lags:
- Source change lag: the time between a change on the website and your next visit.
- Collection lag: the time from visit to extracted, validated record.
- Delivery lag: the time from validated record to the table your analyst queries.
Most freshness checks see only the third.
Here is a dbt source freshness check, in the syntax used from dbt 1.10 onward (as of September 2026):
dbt: source freshness check (dbt 1.10+ syntax)
sources:
  - name: vendor_feed
    config:
      loaded_at_field: _etl_loaded_at
      freshness:
        warn_after: {count: 12, period: hour}
        error_after: {count: 24, period: hour}
    tables:
      - name: products
This is worth running, and it measures load time. A table loaded an hour ago can hold prices last verified a month ago. Add a last_verified_at column per record, set when the value was last confirmed at the source, and alert on its age.
Google's SRE Workbook gives three ways to write a freshness objective: a share of data processed within a time limit, the oldest data being no older than a limit, or the pipeline job completing within a limit. The third is a run-success check wearing a freshness label. Prefer the second for external data.
Set the limit per field, by how fast the field changes. Pipino, Lee and Wang formalised this in 2002 as timeliness = max(0, 1 − currency ÷ volatility)^s, where volatility is how long a value stays valid. A price that changes daily and a company's legal name age at different speeds. Among SEC-reporting companies in 2025, 27.1% changed chief executive or chief financial officer while 3.6% changed legal name, as our B2B data decay statistics show. One refresh cadence for the whole file is wrong in both directions.
Named teams write this down. Airbnb's Midas certification requires landing-time SLAs backed by a central incident process. Uber defines freshness as the delay after which data is 99.9% complete, which ties freshness to completeness in one number.
For the source change lag, Forage AI's Website Change Monitoring alerts when a tracked data point changes on a website, after a 24-hour baseline that cuts false alerts.
Stale data does more damage than you might expect. A 2025 ACL study found that outdated information in a language model's context caused at least a 20% drop in performance, with a near 50% chance of an outdated passage appearing in the top five retrieved results. We covered that failure in why RAG pipelines fail in production, and the monitoring side in our guide to data observability.
Q: How do you measure data freshness?
A: Measure the age of each value since it was last verified at the source, not the time the table was loaded. External data carries three lags (source change, collection, delivery), and load-time checks see only the last one. Set the allowed age per field by how fast that field changes.
Which dimension should you trade off first?
The three dimensions pull against each other, and every pipeline makes the trade whether or not anyone writes it down.
- Freshness against accuracy: a faster refresh leaves less time to verify each record.
- Accuracy against completeness: stricter validation rejects rows, so fill rate and recall drop.
- Completeness against accuracy: filling gaps raises fill rate and lowers accuracy. A 2025 comparison of web record extraction methods found a deterministic baseline that missed most records and invented none, while a language model reading slimmed HTML had a hallucination rate of 91.46%.
Decide by the decision each field feeds. A pricing feed usually puts freshness first. A training set usually puts completeness and representativeness first. Contact or regulated data puts accuracy first. One rule holds everywhere: never fill a gap you cannot trace back to a source.
Then set thresholds per field, not one blended score, because a single quality score hides which trade you made. For worked threshold tables and release gates, see how automated web scraping companies build QA workflows.
What to ask a data supplier for
The same three numbers are what you should ask for from anyone who sells you data. A percentage with no sample and no date is a claim, not a measurement. Ask for three items per dimension: the number, the method and the date. Call it the number, method, date test.
| Dimension | Ask for | Red flag |
|---|---|---|
| Accuracy | Error rate per field, sample size, how records were checked | "99% accurate" with no sample size |
| Completeness | Fill rate per field and recall against a named register | Row counts only |
| Freshness | Last-verified timestamp per record | The database refresh schedule |
This matters more as AI projects lean on external data. In a Gartner survey of 248 data management leaders published in February 2025, 63% of organisations did not have, or were unsure they had, the right data management practices for AI. An IBM Institute for Business Value study of 1,700 chief data officers, published in November 2025, found only 26% confident their data can support new AI revenue streams.
On the method line, Forage AI runs a 200% QA approach: every extraction goes through automated checks and human verification, and every Forage AI delivery passes a 3x QA team before it lands in your system. If you are comparing suppliers or deciding what to build in-house, our guide to data extraction services covers the wider choice.
Data quality measurement is a habit you run on every delivery, not an audit you finish. The teams that sustain it keep the checks small, in code, and owned by someone who reads the output.
Start this week with one feed. Pull 100 records, check them against their sources, count the fill rate and recall, and look at the oldest last-verified date. Then compare those three numbers with what your pipeline or supplier reports, and share what you find with the people who consume the data. The gap between the two is where your next quality conversation starts.
Frequently asked questions
What are the 6 dimensions of data quality?
The six dimensions most often cited come from DAMA UK's 2013 white paper: completeness, uniqueness, timeliness, validity, accuracy and consistency. Other standards use different counts, including 15 characteristics in ISO/IEC 25012. The list matters less than measuring the dimensions your decisions depend on.
What is the difference between data freshness and timeliness?
Freshness is the age of a value right now. Timeliness asks whether that age is acceptable for the decision the data feeds. A record verified two days ago is equally fresh in every use, but timely for a monthly report and late for a daily pricing rule.
What is the difference between data accuracy and data integrity?
Accuracy asks whether a value matches the real-world thing it describes. Integrity asks whether data stays whole and consistent as it moves between systems, with relationships and keys intact. Data can keep perfect integrity and still be inaccurate, because a wrong value copied faithfully is still wrong.
How do you measure data quality?
Measure one dimension at a time, per field, with a stated method: sampled re-checks against the source for accuracy, fill rate and recall against a register for completeness, and age since last verification for freshness. Report each as a number with its sample size and date.
Is 100% completeness the right target?
Not usually. Pushing fill rate to 100% tends to mean filling gaps with guesses, which lowers accuracy. A known, documented gap is safer than a filled field you cannot trace to a source.
Related articles
- Data Quality Framework for External Sources: The full framework, validation workflow and web scraping QA checklist
- Data Observability for Third-Party Datasets: Freshness checks, schema-drift alerts and early signals of silent failure
- B2B Data Decay Statistics: How fast company and contact records go stale, measured field by field
- How Automated Web Scraping Companies Build Reliable QA Workflows: Validation stages, thresholds and release gates
Sai is a data infrastructure enthusiast who has spent the past two to three years following the AI space closely, from the infrastructure layer to the fast-growing world of data for AI. He is genuinely curious about how modern data pipelines get built and where the data industry is heading, and he writes insightful pieces on the core topics that shape this niche.