For the first eighteen months, the in-house scrapers were a quiet success story. Eighty thousand SKUs across two marketplaces, refreshed daily, feeding the pricing dashboard the merchandising team checked every morning. Two engineers, one weekend per quarter on maintenance. The CFO loved it.
Then the category team launched into beauty, home, and consumables. The SKU count crossed the half-million mark, three new marketplaces landed on the roadmap, and a competitor started running aggressive promo cycles the daily refresh missed by hours. Two engineers became four. The four became a standing on-call rotation. The pricing dashboard started showing yesterday’s prices on the day they mattered most, and the merchandising team, politely at first and then less politely, stopped trusting it.
This is the Scale Wall. E-commerce data scraping does not break because the code is wrong. It breaks because the operating model that worked at 80,000 SKUs is not the operating model that works at 5,000,000 SKUs across a dozen marketplaces. The shape of the work changes. The team you need to run it changes. The way reliability is achieved changes.
This guide is for the data and product leaders at e-commerce and competitive-intelligence companies who recognize that wall, either because they are already standing in front of it or because they can see it from where they are. We will skip the Python tutorials and the residential-proxy product reviews. We will focus instead on what ecommerce data scraping actually delivers as a business capability: how teams turn it into pricing decisions, assortment moves, positioning wins, and review-driven product changes, and what it takes operationally to keep all of that working when the SKU count has six zeros after it.
Quick Digest
- What ecommerce data scraping is for: it is the automated, large-scale collection of structured retail data, collected to drive four decision types, pricing, assortment, positioning, and review intelligence, not for its own sake.
- The four data types: competitor pricing (highest refresh, lowest tolerance for staleness), catalog and assortment (broad coverage), positioning and merchandising (share of shelf), and review and rating data (continuous voice-of-customer), each with its own cadence and internal customer.
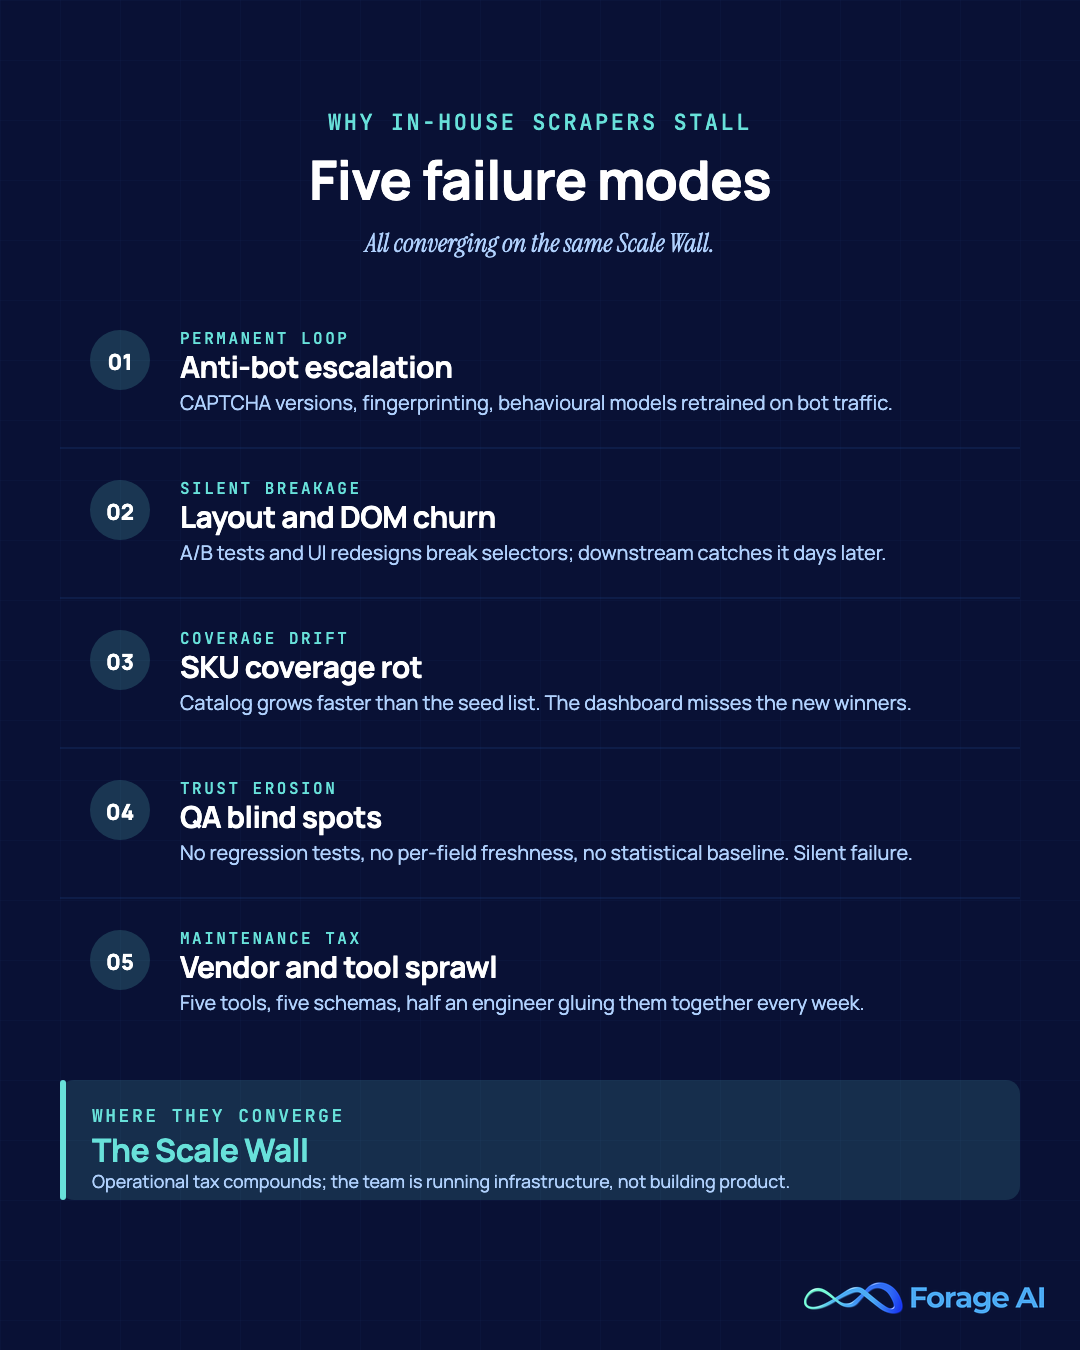
- Where in-house scrapers break: five recurring failure modes, anti-bot escalation, layout and DOM churn, SKU coverage rot, QA blind spots, and vendor sprawl, converge into the Scale Wall above roughly 500,000 SKUs.
- What a managed pipeline looks like: scope locking, multi-method extraction, per-field refresh cadence, a serious QA layer, and delivery into client systems, operated by a dedicated team rather than maintained in-house.
- How to evaluate a partner: a ten-point checklist covering named coverage, per-field cadence, match rate against your own catalog, QA transparency, scale honesty, anti-bot resilience, compliance, and data ownership.
What is E-commerce Data Scraping? What is it used for?
E-commerce data scraping is the automated, large-scale collection of structured information from online retail surfaces: marketplaces like Amazon, Walmart, and eBay; direct-to-consumer storefronts on Shopify and BigCommerce; category specialists like Wayfair and Chewy; and the broader long tail of category-specific retailers. The output is a continuously refreshed dataset describing what is being sold, by whom, at what price, with what attributes, against what reviews, in what visibility position.
That definition is the easy part. The harder part is being honest about what the data is for. E-commerce teams do not collect this data for its own sake. They collect it to drive four categories of decision:
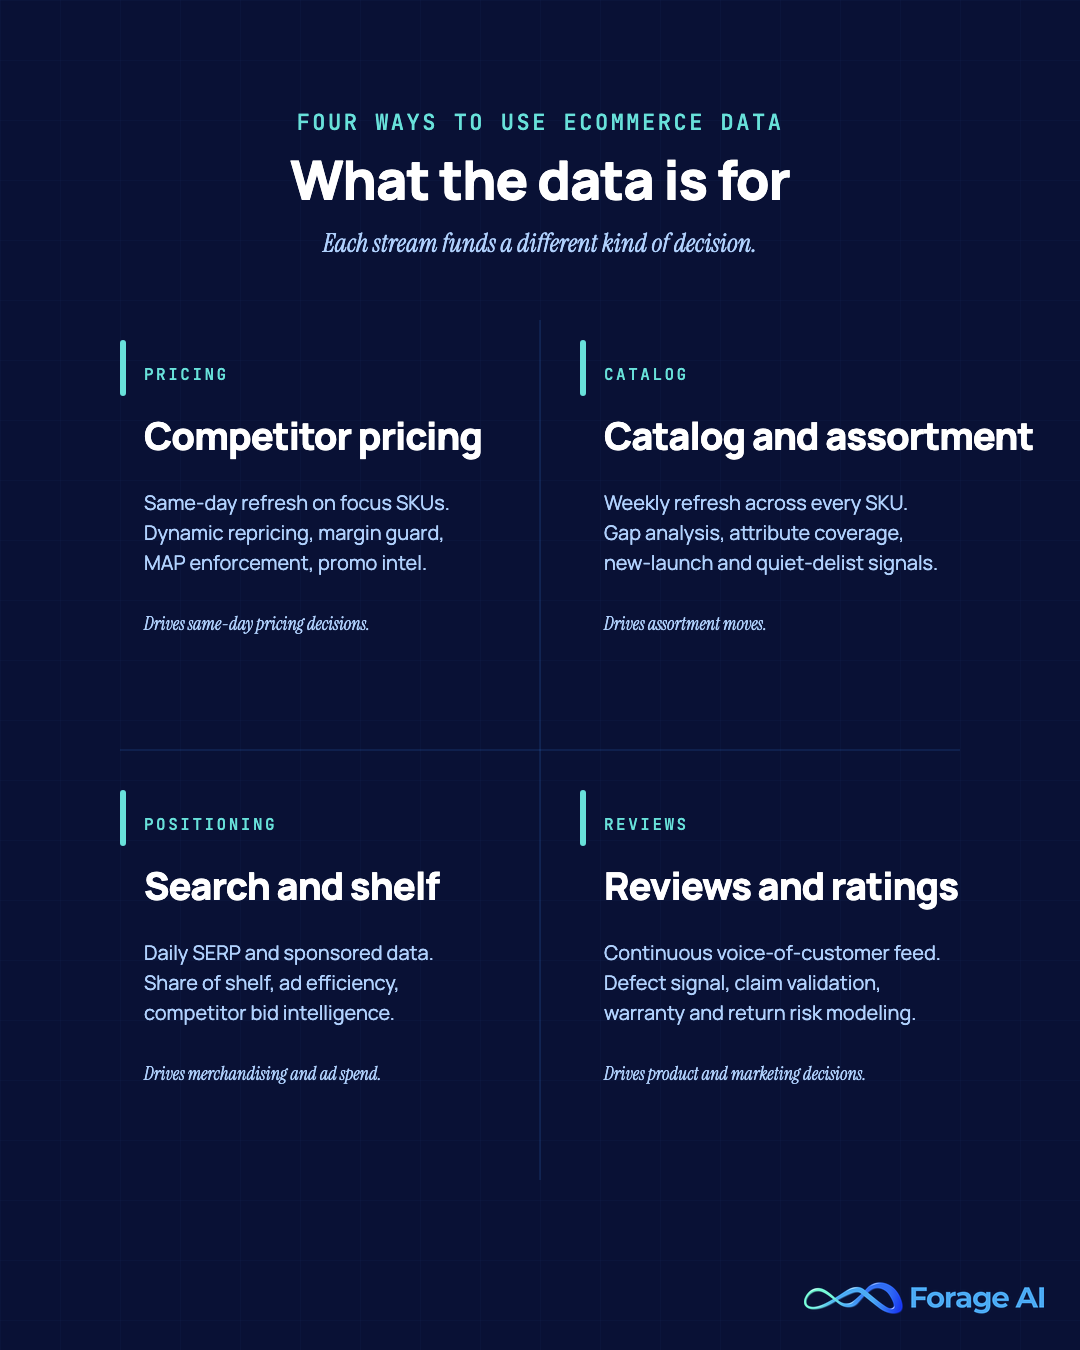
- Pricing decisions: where the competition is moving on the SKUs that matter, how fast, and whether to match, hold, or hold-and-stockpile-margin. This is the price intelligence workstream, the one with the tightest refresh requirements and the lowest tolerance for stale data.
- Assortment decisions: what categories and SKUs competitors are listing that we are not, what is gaining velocity, and what is being quietly delisted.
- Positioning decisions: where our listings rank against the competitor set, who is buying sponsored placement, what share of shelf we hold by query and by category.
- Review and rating intelligence: what customers are actually saying, what defects and friction patterns show up across competitor reviews, what claims our marketing can credibly make.
Each of these is a distinct workstream with its own refresh cadence, field set, and internal customer. A pricing team needs a same-day or faster refresh for a focused SKU set. An assortment team needs broad coverage across the entire competitor catalog, refreshed weekly. A merchandising team needs ranked SERP data on the high-value queries. A product team needs structured review streams flowing into their VOC tooling.
The reason in-house ecommerce scraping programs struggle is rarely that any one of these workstreams is hard in isolation. It is that running all four at once, at scale, across every marketplace your category sits on, with the reliability the downstream teams need, is a managed-pipeline problem, not a scripting problem.
Quick Summary
Q: What is ecommerce data scraping actually for?
A: Ecommerce data scraping is the automated, large-scale collection of structured data from online retail surfaces (marketplaces, DTC storefronts, category specialists). Teams do not collect it for its own sake; they collect it to drive four decision types, pricing, assortment, positioning, and review intelligence. Each is a distinct workstream with its own refresh cadence, field set, and internal customer, which is why running all four at scale is a managed-pipeline problem rather than a scripting problem.
Expert Insights
“The teams that get this right stop asking ‘can we scrape it’ and start asking ‘which decision does this data serve.’ Once you map every field back to a pricing, assortment, positioning, or review decision and its internal customer, the cadence and coverage requirements design themselves. The teams that struggle are the ones treating all four workstreams as one undifferentiated feed.”
Forage AI solutions team, from ecommerce data scoping engagements
Four Types of E-commerce Data
Most articles on e-commerce data scraping treat the data as one undifferentiated stream. In practice, e-commerce data falls into four distinct asset classes, and each one supports a different kind of decision.
Competitor pricing data
Pricing data is the most operationally demanding category. It needs the highest refresh cadence, the tightest accuracy guarantees, and the cleanest joins back to your own catalog.
What it captures
Per-SKU price, list price, discount percentage, promo flag, coupon stack, ship-included price, marketplace seller (when relevant), buy-box ownership, and freshness timestamp. On marketplaces with multiple sellers per listing, the Amazon model, the full seller table per listing matters; ignoring third-party sellers misses half the pricing dynamic.
What it unlocks
Dynamic repricing models, automated systems that adjust your own prices in response to competitor moves within defined guardrails. Margin protection, visibility into when a competitor is selling below your floor and stockpiling share at a loss they cannot sustain. MAP (Minimum Advertised Price) enforcement, early detection of unauthorized resellers violating brand pricing policy. Promotional intelligence, identifying competitor promo cycles before they hit so the response is staged, not reactive. Teams weighing the tooling landscape before committing to an in-house build can review our roundup of competitor price tracking platforms to see what the off-the-shelf options actually cover.
A solid pricing pipeline reads competitor moves before the daily report cycle catches them, so the merchandising team can make the decision instead of reading about it. For a deeper operational walkthrough on this specifically, our guide on ecommerce price monitoring covers the implementation patterns in detail.
Catalog and assortment data
If pricing data is what the merchandising team checks every morning, catalog data is what the category leadership team checks every Monday. The cadence is slower, but the coverage requirement is broader: every SKU in the competitor set, not just the high-value ones.
What it captures
Product title, brand, manufacturer, SKU, and variant identifiers, full attribute set (size, color, dimensions, materials, ingredients, certifications), images, structured description, taxonomy placement, inventory status, and listing freshness. On marketplaces, the variant relationships, parent ASIN to child variants on Amazon, for example, matter as much as the leaf records.
What it unlocks
Assortment gap analysis, categories and SKUs that competitors carry that you do not. Attribute completeness benchmarking, whether your own listings have the depth of attribute data the algorithm rewards. New launch detection, competitor SKUs that first appeared this week or this month, surfaced before they have time to build velocity. Quiet delist detection, competitor SKUs that disappeared, often a leading indicator of supplier issues or strategic retreat. Taxonomy normalization, mapping competitor category structures back to your own, so a “kitchen storage” gap is visible even if a competitor calls it “pantry organization.”
The honest version of an assortment pipeline is that coverage is the hard part. Half-covering your competitor’s catalog hides exactly the gaps you are trying to find.
Positioning and merchandising data
This is the data type most teams underbuild. It captures where listings sit in the marketplace’s actual surfaces, the search results, the category pages, the recommendation rails, not just the listing pages themselves.
What it captures
Organic search rank by query and by marketplace, sponsored placement and ad share by query, buy-box ownership over time, featured-listing flags, share of category page, share of the recommendation rails on competitor listings.
What it unlocks
Share-of-shelf tracking, what percentage of high-value queries your brand actually owns. Sponsored-spend efficiency, whether the queries you are paying for are the queries that drive your category. Competitive sponsored intelligence, which competitors are bidding aggressively on your branded terms. Listing optimization signal, when a listing’s organic rank moves, the title, image, A+ content, and review changes that may have caused it.
Positioning data turns “we have good products” into “we have visibility on the queries that matter.” It is also the data type that requires the most disciplined query-set management: scraping everything is wasteful; scraping the right two thousand queries is the work.
Review and rating data
Reviews are often treated as a target, can we scrape it, when the real question is what do we do with it once it is flowing. For the teams that get the most out of review data, the answer is that it is a continuously refreshed voice-of-customer feed that informs the roadmap, marketing copy, and the warranty risk model.
What it captures
Per-review text, rating, reviewer attributes (verified purchase, age of account), product variant reviewed, timestamp, helpful-vote counts, and review velocity trends. On the aggregate side: rating distribution by SKU, by brand, by category, including how that distribution moves week over week.
What it unlocks
Voice-of-customer programs, structured review streams flowing into product management and marketing tooling, not living in PDFs that the merchant team emails around. Defect signal, sudden review-rating drops on a SKU as a leading indicator of a quality or supplier issue. Claim validation, language patterns from competitor reviews that surface what customers actually praise, so your marketing can match or differentiate without guessing. Warranty and return risk modeling, review themes that correlate with return rates, used to flag SKUs before the returns hit.
Reviews are also the most legally and ethically sensitive category, which is why a serious ecommerce data program runs them under the same compliance framework as the rest of its scraping work: robots.txt compliance, alignment with marketplace terms of service, PII handling, and rate-limit discipline. Our legal and ethical web scraping guide covers the compliance framework in depth.
Quick Summary
Q: What are the four types of ecommerce data, and what does each one drive?
A: Ecommerce data falls into four asset classes. Pricing data (highest refresh, tightest accuracy) drives repricing, margin protection, and MAP enforcement. Catalog and assortment data (broad coverage, weekly) drives gap analysis and launch/delist detection. Positioning and merchandising data drives share-of-shelf and sponsored-spend efficiency. Review and rating data feeds voice-of-customer, defect signal, and warranty-risk modeling. Each needs its own cadence, field set, and coverage discipline.
Expert Insights
“Positioning data is the one teams consistently underbuild, and it’s the one that changes the conversation in the room. Knowing your price is table stakes. Knowing you own twelve percent of share-of-shelf on the queries that drive the category, and which competitor is bidding on your branded terms, is what turns a scraping program into a merchandising weapon.”
Forage AI solutions team, from ecommerce data scoping engagements
Where In-House Ecommerce Scrapers Break
Most e-commerce data programs start the same way: an engineer writes a Python scraper for the highest-priority marketplace, the dashboard gets built, the merchandising team is happy, and the project gets quietly anointed as “working.” Then the program scales, more marketplaces, more SKUs, more refresh, more downstream consumers, and the original architecture starts breaking in patterns that are predictable enough to name.
Anti-bot escalation as a permanent maintenance loop
Major marketplaces continuously update their anti-automation defenses. CAPTCHA versions change, browser fingerprinting checks tighten, and behavioral models are retrained on bot traffic patterns. An in-house scraper that worked in March is partially broken in April and visibly degraded by June. The team is permanently allocating engineering capacity to defenses they did not build the product to solve.
Layout and DOM churn
Listing pages change. A/B tests run. Marketplace UI redesigns ship. Each one breaks a subset of the extraction selectors, and the team only finds out when downstream consumers complain, usually two to four days after the data stopped being accurate, because the upstream metrics did not catch it. Website change monitoring is itself a distinct discipline; bolting it onto an ad-hoc scraper after the fact is more expensive than building it in from day one.
SKU coverage rot
The catalog grows faster than the scraper’s source list. New competitor listings appear, get velocity, and inform decisions, but only after someone manually adds them to the seed list weeks later. Coverage drifts down quarter over quarter. By the time leadership notices, the assortment dashboard has a credibility gap.
QA blind spots
Most in-house scrapers do extraction well and validation poorly. There is no automated regression test for “the price field is now sometimes a string instead of a number.” There is no per-field freshness check. There is no statistical baseline that flags “price extraction dropped from 99.2% to 88.7% on this marketplace overnight.” The data fails silently, and silent failures are the worst kind.
Vendor and tool sprawl
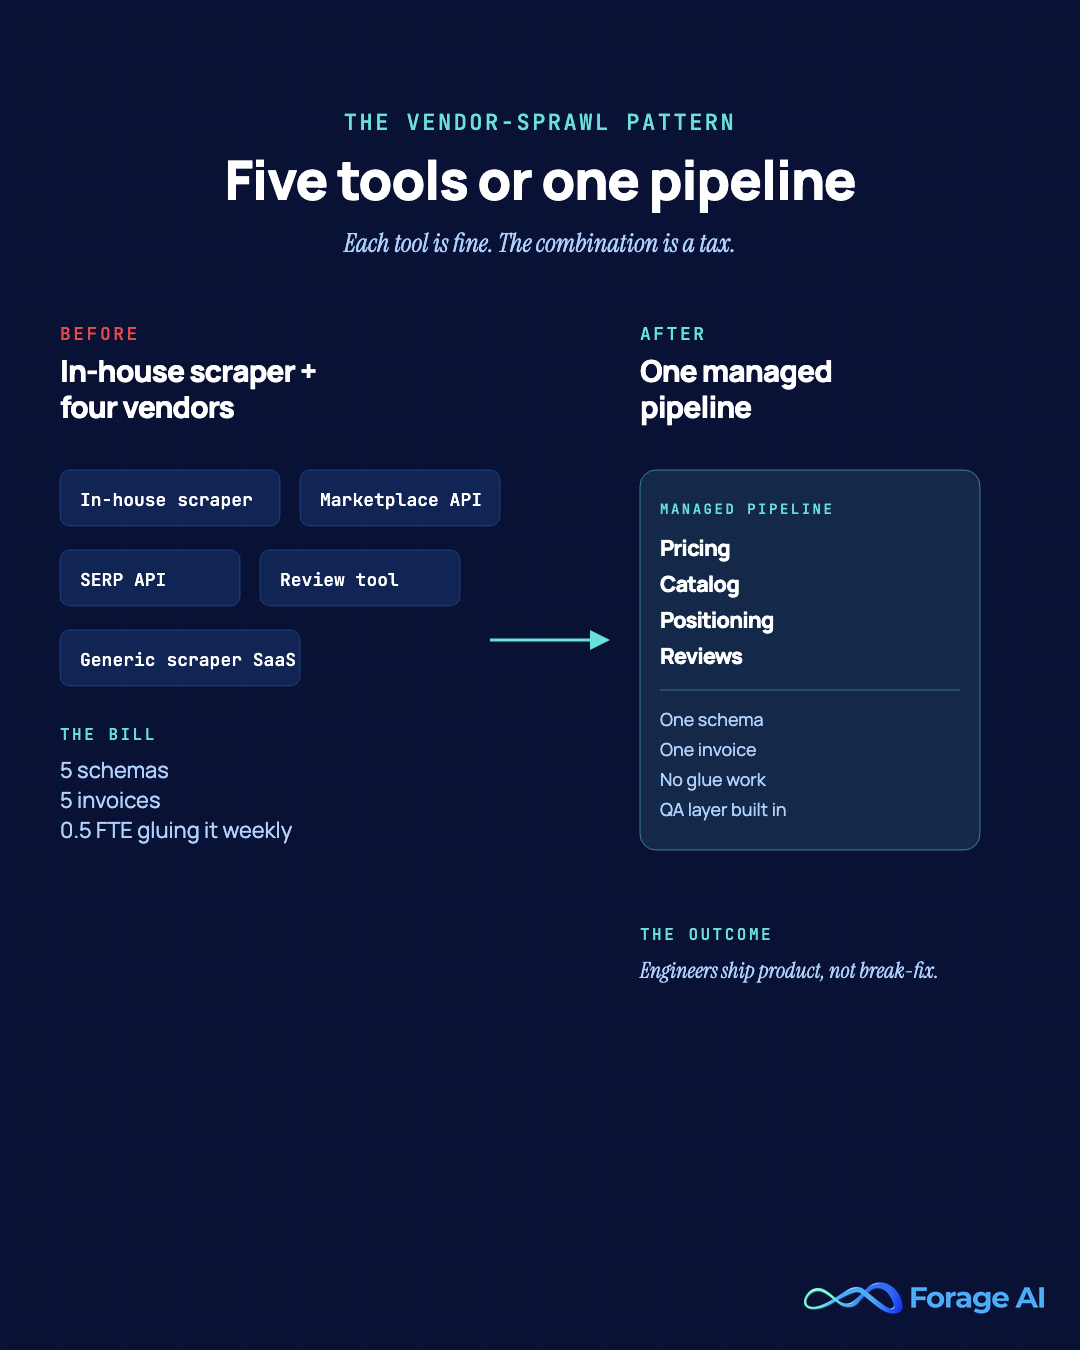
The team starts with one in-house scraper. To handle Amazon, they add a third-party scraping API. For SERP data, a SERP API. For reviews, a tool specific to reviews. For DTC sites, a generic scraping platform. Eighteen months in, the team is managing five vendor relationships, five schemas, five invoices, and a half-engineer-equivalent gluing the outputs together every week. Each tool is fine; the combination is a maintenance tax. This is the same vendor-sprawl pattern we describe in the in-house scraping regrets breakdown, and it is the most common reason teams eventually switch operating models.
The Scale Wall
The pattern these failures combine into is what we call the Scale Wall. Below roughly 100,000 to 200,000 SKUs across a small marketplace set, an in-house scraping program can be run by a small focused team without dominating their work. Above roughly 500,000 SKUs, especially across multiple marketplaces with daily-or-faster refresh, the operational tax compounds, and the engineering team that was supposed to be building the product is, in practice, running infrastructure. The Scale Wall is where the build-versus-buy conversation is no longer a strategy question; it is an arithmetic one.
Quick Summary
Q: Why do in-house ecommerce scrapers break as they scale?
A: Five failure modes compound: anti-bot escalation that turns into a permanent maintenance loop, layout and DOM churn that breaks selectors silently, SKU coverage rot as the catalog outgrows the seed list, QA blind spots where data fails without anyone noticing, and vendor sprawl across five tools and five invoices. Together they form the Scale Wall, which typically hits above roughly 500,000 SKUs across multiple marketplaces. At that point build-versus-buy stops being a strategy question and becomes an arithmetic one.
Expert Insights
“The failure almost nobody budgets for is the silent one. A scraper does not throw an error when a price field starts coming back as a string instead of a number, it just quietly poisons the dashboard, and you find out when merchandising stops trusting it. By then the credibility damage is done. The fix is not better scrapers; it is a QA layer that catches the divergence in hours, not days.”
Forage AI solutions team, from ecommerce data scoping engagements
What a Managed Ecommerce Data Pipeline Looks Like
The alternative to running an in-house ecommerce scraping program is to operate ecommerce data as a managed pipeline, one you scope, configure, consume, and pay for, but do not maintain. The shape of that operating model is consistent across managed providers; what varies is depth, scale, and the seriousness with which QA work is taken.
Source discovery and scope locking
The first phase is not extraction; it is mapping the data universe to the use cases. Which marketplaces and DTC surfaces matter for the category? Which seller and brand cohorts are in scope? Which query sets are the high-value ones for positioning data? Which review sources drive VOC and which are noise? Done well, this phase is the work that prevents the SKU coverage rot pattern from showing up six months later, because coverage is defined and continuously expanded, not assumed.
Multi-method extraction
A pipeline that survives marketplace anti-automation cycles uses multiple extraction methods per source. XPath and CSS selectors for the stable, structured surfaces. NLP-based parsing for the messier description and review fields. Custom-trained ML models for variant-relationship resolution, attribute normalization across taxonomies, and image-based attribute extraction where text is missing. Running multiple methods in parallel is what creates resilience: when one method degrades, the others are still producing, and the QA layer catches the divergence. This is the same operating model we describe in our deep dive into AI-powered extraction across major marketplaces.
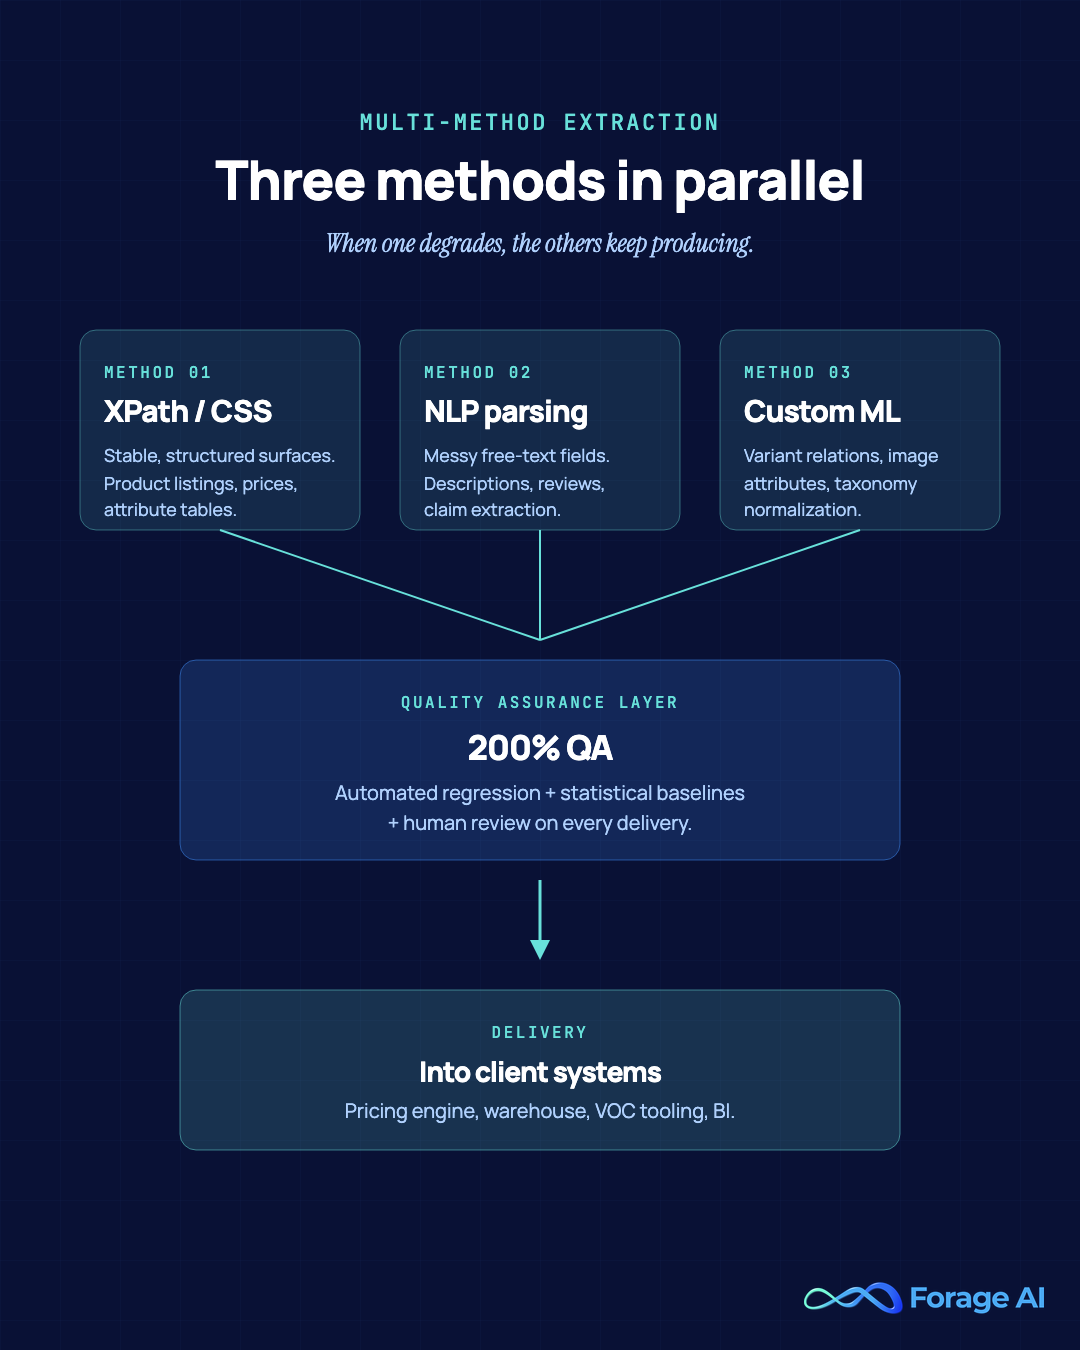
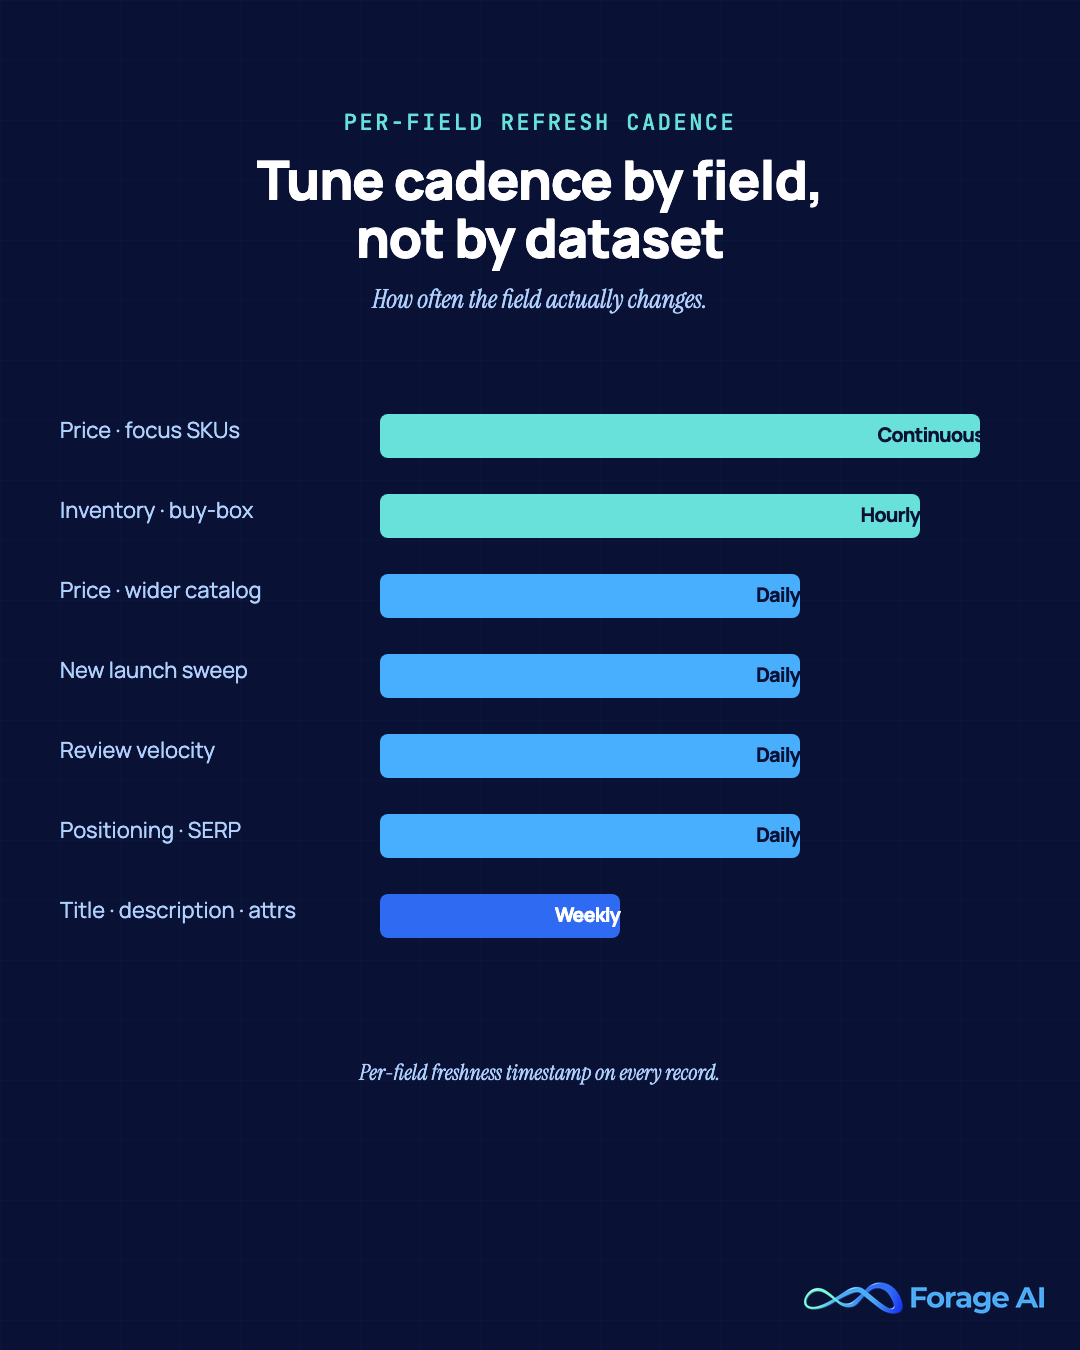
Refresh cadence per field, not per record
A managed pipeline treats refresh cadence as a per-field setting tuned to how often that field actually changes. Price: every few hours on focus SKUs, daily across the broader catalog. Inventory and buy-box: continuous on focus SKUs. Title, description, attributes: weekly. New-launch detection: daily sweep of new ASINs and new listings. Review velocity: daily aggregate, with individual review pull at the cadence the downstream system needs. Per-field freshness timestamps on every record so the consuming team can decide what to trust.
The QA layer that makes scale honest
Freshness without quality assurance is just noise at a higher frequency. A managed pipeline runs three things in parallel: automated regression testing that catches schema drift and extraction-rate drops within hours; statistical baselines that flag field-level accuracy degradation; and human review for edge cases the automation flagged. Forage AI runs a QA team that is three times the industry average size relative to delivery, and that ratio is the difference between a pipeline that fails silently and one whose failures are caught and announced before downstream consumers see them.
Delivery into client systems
The output is not a CSV emailed weekly. It is structured data delivered into the systems the consuming teams actually use, the pricing engine’s API, the merchandising data warehouse, the VOC tooling, the BI layer. Format and cadence are configured per consumer. Data ownership remains with the client; the managed provider does not resell or aggregate derivatives.
The Forage AI operating model
This is the operating model Forage AI’s ecommerce data service is built on: managed pipelines covering product, pricing, catalog, positioning, and review data across major marketplaces and DTC surfaces, scaled to millions of SKUs, with the QA layer and the data-ownership commitments above. Onboarding typically runs one to two weeks from brief to live pipeline. The team operating the pipeline is dedicated, not a support queue. The data is yours, and stays yours.
Quick Summary
Q: What does a managed ecommerce data pipeline actually look like?
A: A managed pipeline is one you scope, configure, and consume but do not maintain. It runs five consistent components: source discovery and scope locking, multi-method extraction (XPath, NLP, and ML models in parallel), per-field refresh cadence rather than per-record, a QA layer with regression testing and statistical baselines, and delivery into the client’s own systems. Forage AI runs this model across major marketplaces and DTC surfaces at millions-of-SKUs scale, with a dedicated team and one-to-two-week onboarding.
Expert Insights
“The component buyers undervalue in a managed pipeline is the QA layer, because it’s invisible when it’s working. We run a QA team three times the industry-average size relative to delivery, and that ratio is the whole game. It’s the difference between a failure your downstream teams catch and a failure that quietly erodes their trust in the data for a month.”
Forage AI solutions team, from ecommerce data scoping engagements
How to Evaluate an E-commerce Data Partner
If the in-house program is showing cracks and the conversation has shifted to “who do we partner with” among the specialized ecommerce data providers on the market, use the following checklist. It is the same one we use when we walk teams through the evaluation honestly, including against ourselves.
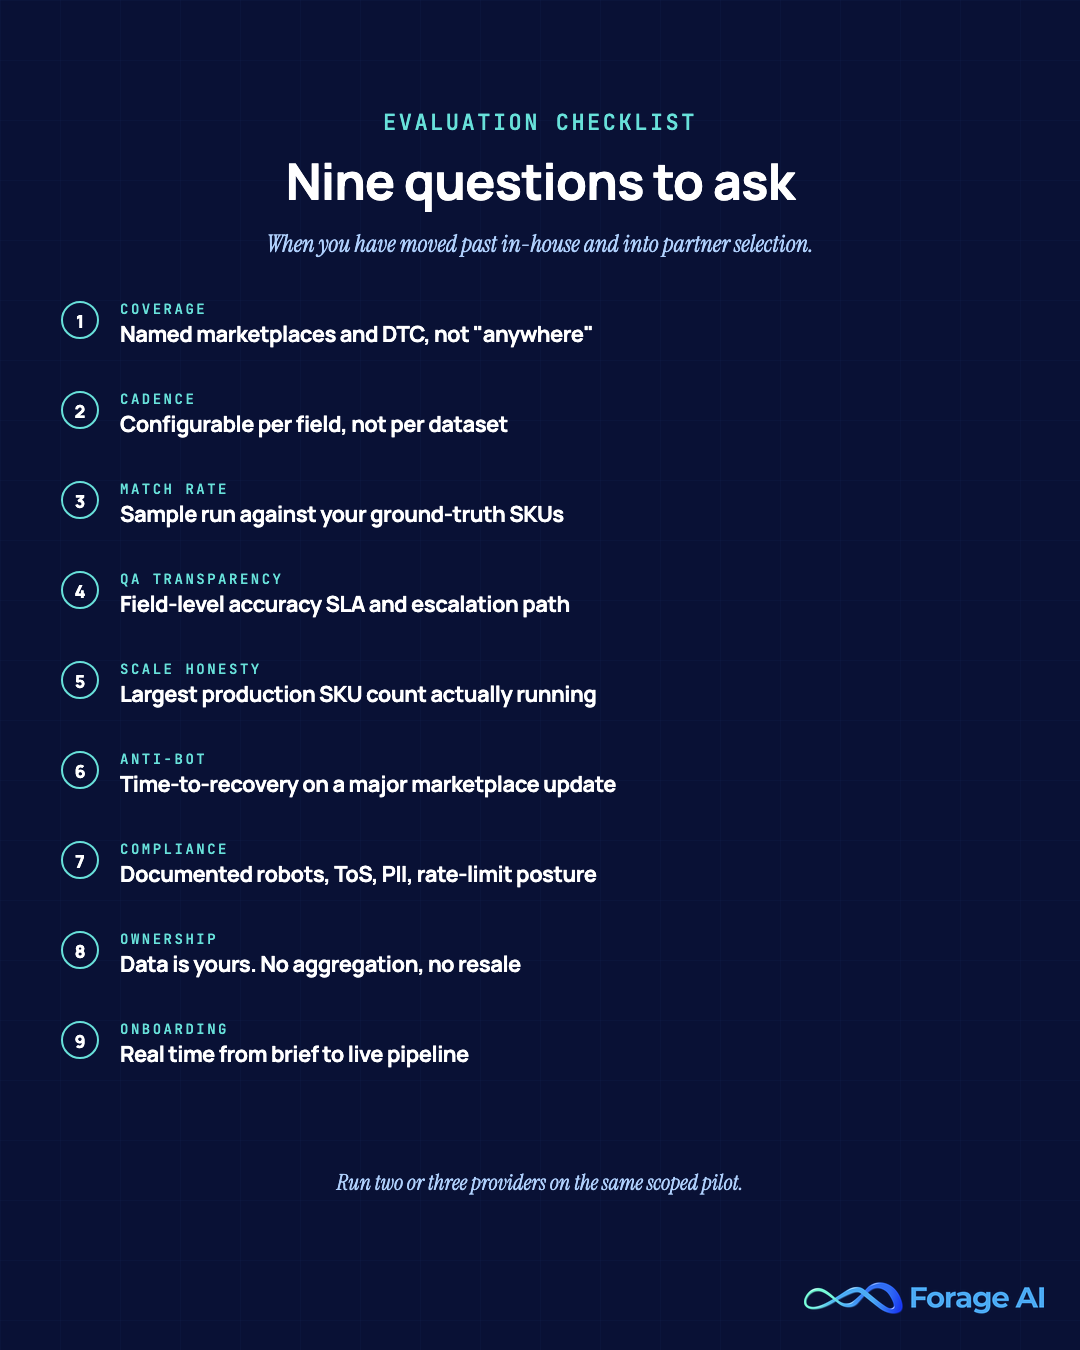
- Marketplace and DTC coverage. Which marketplaces and DTC platforms are in scope, by name? Coverage at “we can scrape anything” level is meaningless; coverage by named platform and named geography is what matters.
- Refresh cadence, per field. Is cadence configurable per field, or is the dataset on a one-size-fits-all schedule? A pricing use case and a catalog use case need different cadences; if the provider cannot offer both, the pipeline is wrong-shaped for at least one of your workstreams.
- Match rate to your own catalog. Ask for a sample run against a known set of your own SKUs and a known set of competitor SKUs. Measure match rate, attribute completeness, and price accuracy against ground truth. This is the single best signal of real-world quality.
- QA transparency. Can the provider show you their QA process? What is the field-level accuracy SLA? How are failures detected, escalated, and resolved? If the answer is vague, the QA is probably vague.
- Scale honesty. What is the largest SKU count and the highest refresh cadence the provider currently runs in production? Pilots are interesting; production scale is the actual signal.
- Anti-bot resilience. How does the provider handle anti-automation cycles in the marketplace? What is the typical time-to-recovery when a major marketplace ships a CAPTCHA or fingerprinting update?
- Compliance posture. Is the program run under a documented compliance framework: robots.txt respect, ToS alignment, PII handling, rate-limit discipline?
- Data ownership and reuse. Is the data you receive yours exclusively, or does the provider aggregate and resell derivatives? For competitive intelligence work, the answer matters more than it does for many other data categories.
- Onboarding speed. Time from brief to live pipeline. Real numbers, not marketing numbers.
- Build-versus-partner clarity. If you are still weighing whether to bring this in-house, the build-vs-buy decision guide walks through the full TCO and team-shape comparison.
A practical way to run the evaluation is to give two or three candidate providers the same scoped pilot, a focused SKU set, a defined refresh cadence, and a clear set of fields, and compare the resulting datasets against your own ground truth. Match rate and accuracy on real data tell you more than any sales conversation.
Quick Summary
Q: How should you evaluate an ecommerce data partner?
A: Score candidates on named marketplace and DTC coverage, per-field refresh cadence, match rate against your own and competitor SKUs, QA transparency and field-level SLAs, production scale honesty, anti-bot time-to-recovery, documented compliance posture, and exclusive data ownership. The single best test is a scoped pilot: give two or three providers the same SKU set, cadence, and field list, then compare match rate and accuracy against your own ground truth. Real data beats any sales conversation.
Expert Insights
“The most honest signal you can ask a provider for is a sample run against your own SKUs and a competitor’s, scored against ground truth you control. We tell teams to run the same scoped pilot across two or three vendors at once. A vendor confident in their match rate will welcome it; a vendor who only wants to talk about capabilities in the abstract is telling you something.”
Forage AI solutions team, from ecommerce data scoping engagements
Frequently Asked Questions
What is e-commerce data scraping, in simple terms?
E-commerce data scraping is the automated collection of structured data from online retail surfaces: marketplaces, DTC storefronts, and category specialists. The output is a continuously refreshed dataset that describes products, prices, inventory, search rank, reviews, and related signals, used by ecommerce and competitive intelligence teams to drive pricing, assortment, positioning, and product decisions.
Is e-commerce data scraping legal?
Scraping publicly available data is generally legal in most major jurisdictions, but the answer depends on the source, data type, geography, and how the program is operated. A serious e-commerce data program runs under a compliance framework that covers robots.txt, alignment with marketplace terms of service, PII handling, and rate-limiting discipline. The honest version is that legality is operational, not theoretical: how you do it matters as much as whether you do it.
Which e-commerce platforms can be scraped?
The major marketplaces, Amazon, Walmart, eBay, Target, are commonly covered, along with Shopify-powered DTC stores, BigCommerce stores, and category-specific retailers like Wayfair, Chewy, Best Buy, and Home Depot. Each surface has its own structural patterns and its own anti-automation profile, which is why a multi-method extraction approach matters more than picking a platform-specific tool.
How often should e-commerce data be refreshed?
It depends on the data type. Pricing data for focus SKUs typically needs a same-day or faster refresh, every few hours is common, and continuous refreshes are common on the most contested SKUs. Catalog and attribute data are usually refreshed weekly. New-launch detection is a daily sweep. Reviews are typically aggregated daily, with a per-review pull at the cadence the downstream consumer needs. A good pipeline configures cadence per field, not per dataset.
What is the difference between scraping ecommerce data and buying it from a pre-built dataset?
Pre-built ecommerce datasets ship a fixed schema, fixed coverage, and a fixed refresh cadence. They are convenient but rarely fit a specific competitive-intelligence use case. A managed scraping pipeline is custom-built, your marketplaces, your SKU sets, your fields, your cadence, and refreshes against the actual sources continuously. For teams whose competitive intelligence is core to product or pricing strategy, the custom managed pipeline is almost always the right shape.
When should we move from in-house scraping to a managed partner?
The most common trigger is the Scale Wall, when the SKU count, marketplace count, or refresh cadence makes in-house maintenance dominant over in-house building, and the engineering team is allocating more time to scrapers than to product. Other common triggers include a vendor failure event, a downstream credibility loss due to stale data, or a leadership demand for broader coverage that the current team cannot ramp up. A useful frame is: when your engineers are spending more time on pipeline maintenance than on product engineering, the operating model is already wrong.
Conclusion
E-commerce data scraping is not, in 2026, a technical problem. The extraction methods are well understood, the marketplaces are well mapped, and the patterns of failure are well documented. The hard part is operating the program reliably as it scales, running pricing, catalog, positioning, and review pipelines together, across every marketplace your category sits on, at the refresh cadence the consuming teams need, with the QA layer that makes the data trustworthy.
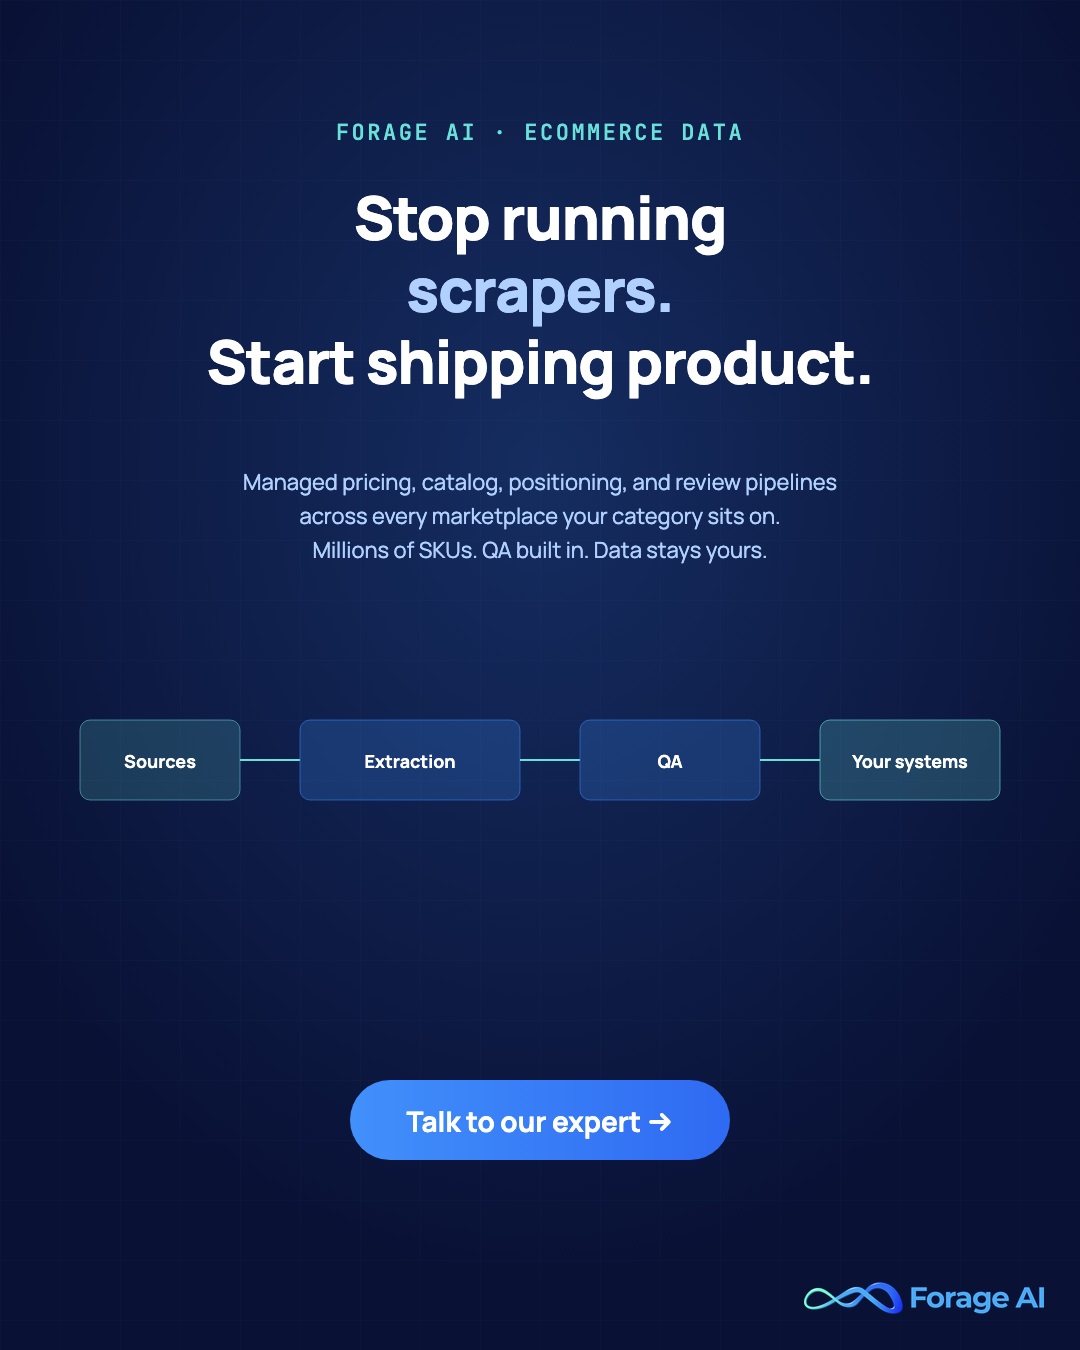
The teams that get the most out of ecommerce data are the ones who treat it as managed infrastructure rather than a scripting project, whether they run that infrastructure themselves with a dedicated team or partner with someone whose only job is to run it. If you are weighing what that operating model would look like for your specific catalog, marketplace footprint, and refresh requirements, talk to our expert, we will walk through what your pipeline would actually look like and what it would take to stand it up.
Related Articles
- 5 Best E-commerce Data Extraction Solutions: Buyer’s comparison of leading e-commerce data extraction providers.
Sai is a data infrastructure enthusiast who has spent the past two to three years following the AI space closely, from the infrastructure layer to the fast-growing world of data for AI. He is genuinely curious about how modern data pipelines get built and where the data industry is heading, and he writes insightful pieces on the core topics that shape this niche.