At Forage, we run extraction pipelines that feed analytics teams inside payers, IDNs, life-sciences vendors, and provider-intelligence platforms. The shape of the work is consistent. Every week, an analytics lead opens a market-sizing dashboard built off a provider directory that was last reconciled three months ago. The numbers look fine: row counts within tolerance, schema valid, downstream BI green. The dashboard is wrong anyway, because forty percent of the underlying provider addresses have moved, fifteen percent of the practices have been acquired, and the affiliation graph still shows two surgeons at a group their system divested last quarter. The pipeline thinks it succeeded. The strategy meeting that runs on the dashboard at 9 a.m. inherits the staleness.
This article is the operational walkthrough we wish existed when we first started running this pattern at scale. It assumes acquisition is solved (start with our piece on healthcare data extraction if that part is still open) and that the pipeline already exists (covered in healthcare data management). What we cover here is the analytics layer that sits on top: what external healthcare data actually is, the five durable use cases, why directory freshness silently kills decisions, the affiliation graph that holds the whole thing together, the reference architecture we keep coming back to, and the eight questions to take into a vendor conversation. One scope note before we start. We are deliberately not writing about clinical analytics on PHI for treatment decisions. That work is regulated differently, sits on different stacks, and serves a different audience. Everything below is external, market-facing, defensible in front of a compliance review without a single PHI record in the pipeline.
- Where you are on the data maturity curve
- Five roads that lead nowhere — and why each one breaks
- Three paths to data that scales, and what each one costs

Quick Digest
- What this is: an end-to-end operational guide to the external healthcare data analytics layer, written for a VP/SVP of Data who is already running pipelines at scale.
- What it isn’t: a clinical-analytics primer, a careers explainer, or a vendor-comparison listicle.
- What healthcare data analytics means in 2026: what healthcare data analytics actually means in 2026 and the line we draw between market/competitive analytics and clinical-PHI analytics.
- The five external data-type buckets: the five data-type buckets that make up “external healthcare data” (directories, affiliations, claims-derived attributes, organizational events, news/leadership signals).
- The five use cases + the freshness problem: the five durable analytics use cases and the freshness problem that quietly breaks all of them.
- The affiliation graph + the six-stage workflow: the affiliation graph as the spine of the whole layer, plus the six-stage workflow that turns raw external data into analytics-ready records.
- Where Forage sits + the compliance posture: where Forage sits in the stack, and the compliance posture analytics teams need to bring to procurement.
- Reference architecture + the vendor checklist: a reference architecture diagram and the eight-question vendor checklist to take into the next conversation.
What healthcare data analytics actually means in 2026, and the line we’re drawing
“Healthcare data analytics” is an umbrella term wide enough to hide three completely different jobs.
- One job is clinical analytics: risk scoring, predictive readmission, value-based-care performance, EHR-driven cohort modeling. PHI lives at the center of that work, and the regulatory floor is HIPAA-with-teeth.
- A second job is operational analytics inside a hospital or payer: throughput, denials, scheduling.
- The third job, and the one this article is about, is external-data analytics: market sizing, competitive intelligence, M&A and affiliation tracking, network adequacy, cohorting for BD. The inputs are non-PHI. The customers are commercial, strategic, and product teams. The compliance lift is real but it is not the same lift.
The budget reality says the umbrella is large and growing. The global healthcare analytics market sat at roughly USD 70 billion in 2026 and is projected to reach USD 192.78 billion by 2031 at a 22.46% CAGR, per Mordor Intelligence. The US healthcare big data analytics market alone was $24.7B in 2025 and is forecast to hit $62.43B by 2034, per IMARC Group. North America carries 49% of the global healthcare analytics market, and the predictive analytics segment is growing fastest at a 24.7% CAGR through 2030 (Knowi 2026 roundup, synthesizing Towards Healthcare). Most of that headline number belongs to clinical analytics. The external-data slice is smaller, growing faster on a percentage basis, and almost entirely the focus from here on out.
If you arrived here looking for clinical risk modeling on PHI, you are in the wrong piece. That is a different stack, a different audit posture, and a different reader. Everything from H2-2 forward assumes you are building analytics on the non-PHI universe: directories, affiliations, organizational events, claims-derived attributes that are de-identified at source.
A scope-split table that we run through internally on every healthcare prospect call:
| Dimension | Market / competitive analytics (in scope) | Clinical analytics on PHI (out of scope) |
|---|---|---|
| Primary audience | VP/SVP of Data, strategy, BD, product | Chief Medical Officer, clinical informatics, actuarial |
| Primary data type | Provider directories, affiliations, news/leadership, claims-derived attributes (no PHI) | EHR records, claims with PHI, lab feeds, ADT |
| Regulatory regime | HIPAA-adjacent + state privacy regimes; BAA-ready if PHI-adjacent data touches the pipe | HIPAA-with-teeth, BAA mandatory, IRB for research use |
Q: What is healthcare data analytics, and what is this article actually about?
A: Healthcare data analytics is the umbrella for clinical, operational, and external-data analytics. This article is only about the external-data layer: the market, competitive, M&A, and network analytics that run on non-PHI sources like provider directories, affiliations, organizational events, and claims-derived attributes. Clinical-PHI analytics is a different stack.
Expert Insights
The market data confirms the budget line is real. Healthcare analytics is a USD 70B global market in 2026 trending to $192.78B by 2031 (Mordor Intelligence, as of 2026). The US big-data slice is $24.7B in 2025 (IMARC). North America carries 49% of the global market. We treat those numbers as table-setters, not selling points. The reason analytics teams care is that an increasing share of strategic decisions, payer network filings, M&A diligence packs, and product launches now require external-data evidence per record, not per quarter.
What “external healthcare data” actually covers
The shape of the inputs determines the shape of the analytics. Before we walk use cases, here is the five-bucket inventory we work from every time a new healthcare customer comes online.
Provider directories. The NPI-anchored record of who practices where, in what specialty, at what address, accepting which payers. The federal NPI registry is the floor. Real practitioner-grade directories layer on practice attribution, sub-specialty taxonomy, languages, telehealth flags, and address verification per record.
Hospital and IDN affiliation data. Which physicians are affiliated with which groups, which groups roll up to which facilities, which facilities sit inside which integrated delivery network. The graph is multi-tier. Definitive Healthcare publishes affiliation data covering more than 2.8 million healthcare professionals and 301,000 organizations (as of 2026), which is a useful reference point for what a mature provider-intelligence dataset looks like.
Claims-derived attributes (no PHI). Procedure volume per provider per specialty, payer-mix signals, place-of-service distribution, year-over-year volume change. These attributes are derivable from aggregated claims feeds without ever touching a patient identifier. They power the volume side of competitive intelligence and the leakage side of network analytics.
Organizational events. New facility openings, closings, M&A announcements, joint ventures, leadership changes. This bucket is event-shaped, not entity-shaped. The cadence is daily-to-weekly and the signal-to-noise ratio is brutal unless the upstream extraction is doing entity resolution at ingest.
News, leadership, and social signals. Press releases, board appointments, executive moves, conference rosters, podcast guests. Soft signals individually. Strong signals when joined back to the affiliation graph and to organizational events on a temporal axis.
| Data type | Powers | Typical refresh cadence |
|---|---|---|
| Provider directories | Market sizing, network adequacy, cohorting | Weekly to daily; 2-business-day update SLA for payer-facing |
| Affiliation graph | M&A tracking, leakage, competitive intelligence | Weekly to monthly per node; event-driven for M&A |
| Claims-derived attributes (no PHI) | Competitive intelligence, leakage, cohorting | Monthly to quarterly |
| Organizational events | M&A tracking, competitive intelligence | Daily to weekly, event-driven |
| News/leadership/social | Competitive intelligence, cohorting | Daily |
Q: What counts as “external healthcare data” for an analytics team?
A: Five buckets: provider directories, hospital/IDN affiliation data, claims-derived attributes (de-identified), organizational events (M&A, openings, leadership moves), and news/social signals. None of it is PHI. All of it is the substrate the rest of this article runs on.
Expert Insights
A useful sanity check on the scale of mature external-healthcare data: Definitive Healthcare covers 2.8M+ HCPs and 301K organizations (as of 2026). Any analytics layer aimed at the US healthcare market needs to live in that order of magnitude on providers, with affiliation depth that goes at least three tiers (HCP → practice → facility → IDN). If a vendor’s coverage is materially below that floor, the analytics question is not “how do we model this” but “is the underlying universe even representative.”
The five analytics use cases the external-data layer is built for
The use cases we see again and again across customers are durable. They have not changed much in the seven-plus years we have been running healthcare external-data pipelines. What has changed is the cadence and the regulatory pressure on each one.
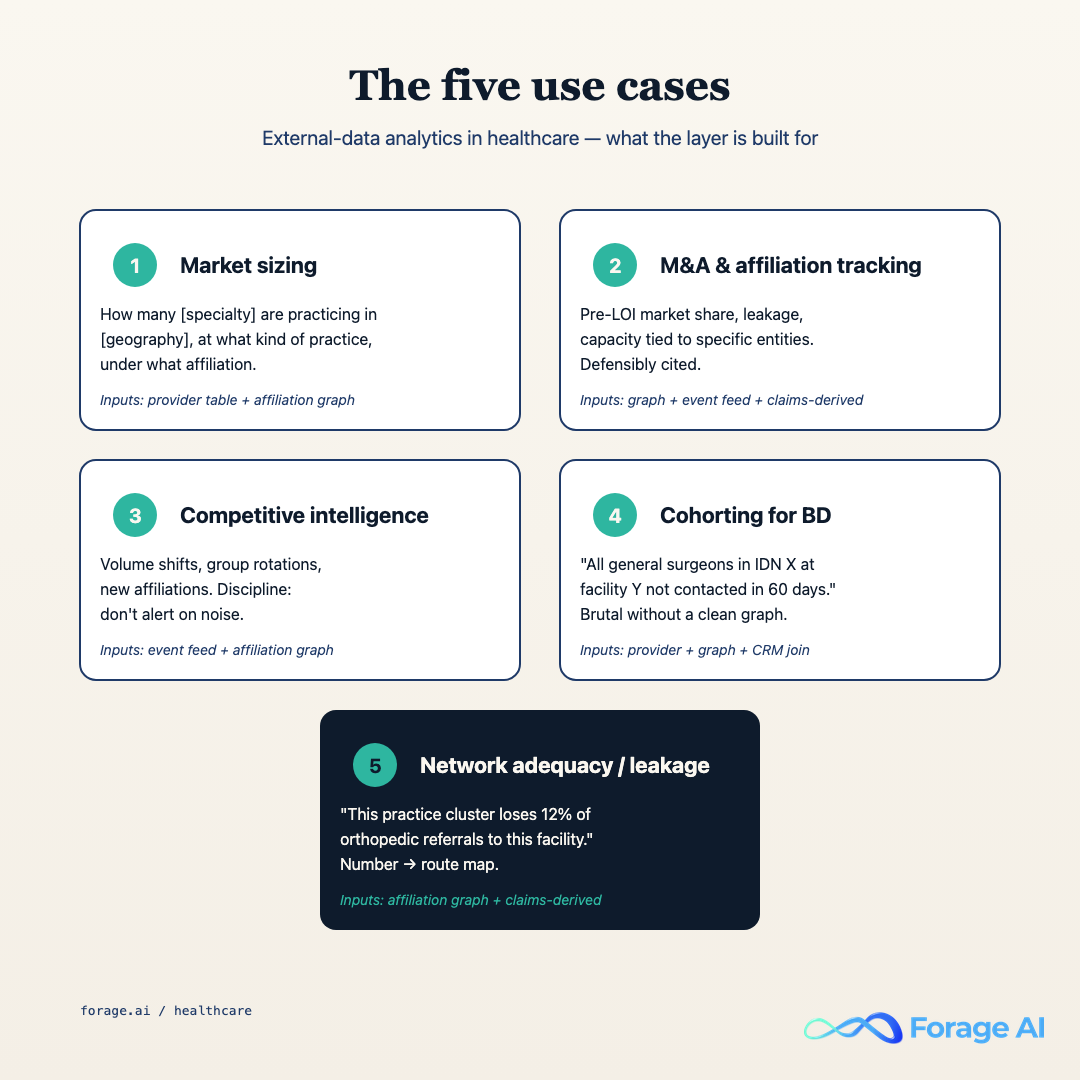
H3.1 Market sizing
This is the simplest one and the one most often quietly wrong. The job is to answer “how many cardiologists in Texas accept Aetna Medicare Advantage and bill at hospitals A, B, or C.” The inputs are provider directories plus affiliation data plus payer-mix attribution. The failure mode is using a stale directory: if your underlying provider file is 90 days old, your market-sizing number for any sub-specialty cohort is off by single-digit percentages on the headline and by double-digits on the long tail.
H3.2 M&A and affiliation tracking
Hospitals and health systems announced 46 M&A transactions in 2025, down from 72 in 2024, but with roughly 43% of 2025 transactions involving a financially distressed party, a record high per Kaufman Hall.
“Historically, technology and talent were primary assets used to weigh the value of M&A activity. Data is now an equal pillar.” Synthesis of Kaufman Hall and KPMG’s 2025 M&A trends
The work product for this use case is a near-real-time view of which provider groups are moving between systems, which affiliations are dissolving, and which physician panels carry the most value if the deal closes. The cadence is event-driven and the source signal is half organizational events, half affiliation-graph delta. Claims-derived volume attributes are how you put a price on each node. See our piece on claims processing automation for the payer-side mechanics on the claims feed.
H3.3 Competitive intelligence on provider behavior
Who is switching health systems. Who is taking new affiliations. Whose case volume in a specific procedure is growing. The reader is usually a commercial team at a medtech vendor, a specialty pharmacy, or a payer evaluating network breadth. The inputs are the same as M&A tracking, run on a per-physician axis instead of per-deal.
H3.4 Cohorting for outreach and BD
Build a target list of all gastroenterologists in the Mid-Atlantic with admitting privileges at one of fourteen specific facilities, who have been at their current practice for more than two years, and whose practice accepts at least two commercial PPO plans. Provider directory + affiliation graph + practice attributes + payer-mix signals. The list ages out in weeks if the freshness regime under it does not hold.
H3.5 Network adequacy and referral leakage
Network adequacy is the regulatory-facing version: can a payer prove there is a primary-care physician within X miles, a cardiologist within Y miles, and so on for every member zip code. Referral leakage is the operational-facing version: a hospital system asking which referrals from its primary-care affiliates went to specialists outside the system, and why. Both use cases are spine cases for the affiliation graph. Both fail silently when the underlying graph is stale.
| Use case | Required external-data inputs | Cadence floor |
|---|---|---|
| Market sizing | Directories + affiliation + payer-mix | Weekly |
| M&A and affiliation tracking | Affiliation + organizational events + claims-derived volume | Event-driven, daily ingest |
| Competitive intelligence | Affiliation + events + claims-derived attributes | Weekly to daily |
| Cohorting for BD | Directories + affiliation + practice attributes | Weekly |
| Network adequacy / leakage | Directories + affiliation + geo | Weekly; 2-day update for payer-facing |
Q: How do healthcare organizations actually use data analytics on external (non-clinical) data?
A: Five durable use cases: market sizing, M&A and affiliation tracking, competitive intelligence on provider behavior, cohorting for outreach and BD, and network adequacy / referral leakage. Each one runs on a different mix of the five external-data buckets, but every one of them depends on the affiliation graph holding together.
Expert Insights
The M&A use case is the one where freshness pays for itself the fastest. 46 deals in 2025, 43% distressed (per Kaufman Hall, 2025): every one of those deals had a diligence window measured in weeks where the buyer needed a live view of the seller’s affiliations, organizational events, and physician panel value. A quarterly-refreshed dataset is structurally unable to support that work. This is the use case where most analytics teams first feel the freshness problem we cover next.
Why provider-data freshness is the silent killer
Provider data decays in weeks. Not quarters. The half-life on a primary-care physician’s practice address is roughly twelve to eighteen months. For specialists in active M&A markets, the half-life on affiliation is shorter still. And the failure mode is silent: the pipeline reports green, the row counts match, the downstream BI loads. The data is just wrong.
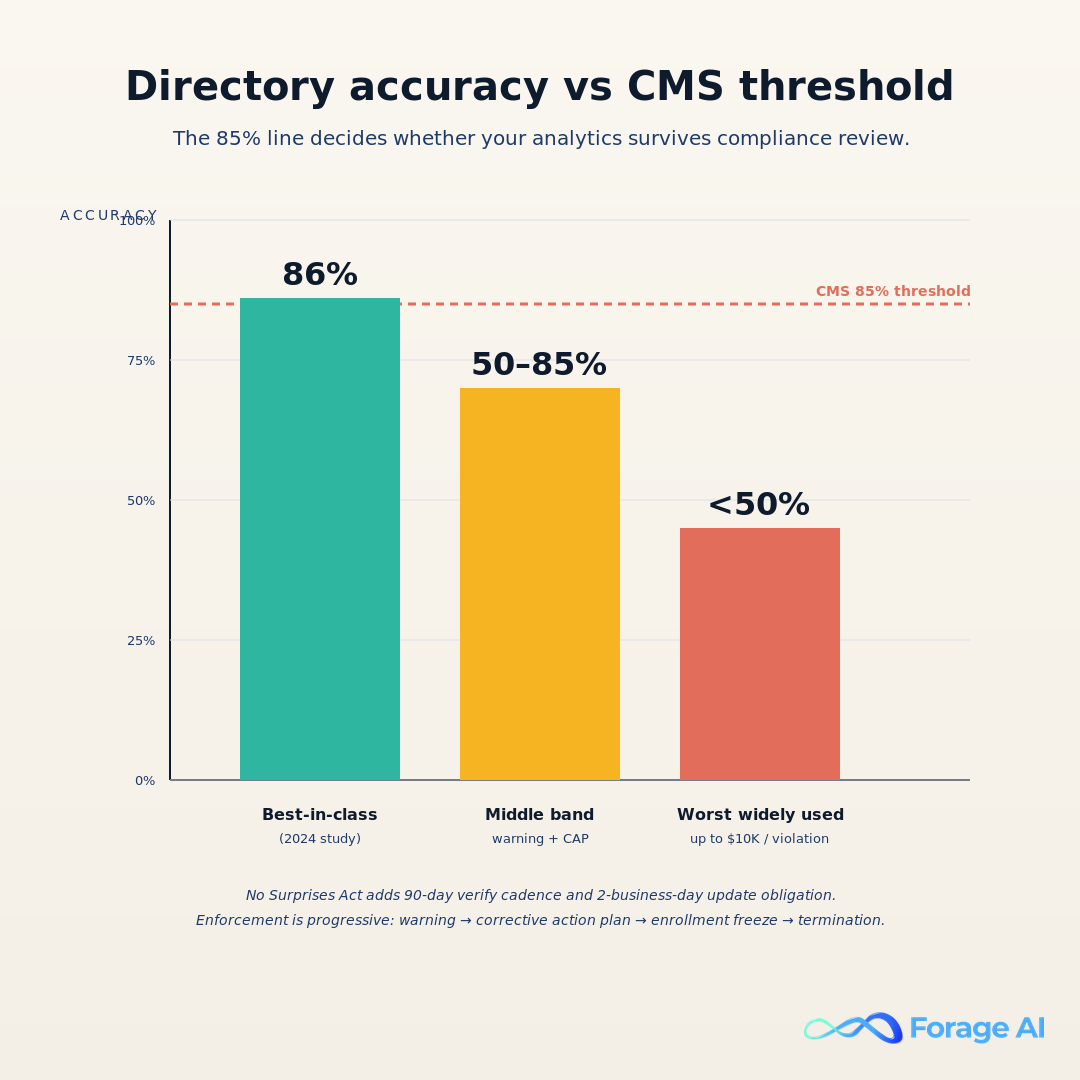
The peer-reviewed evidence is unambiguous. A 2024 AJMC study, Persistence of Provider Directory Inaccuracies After the No Surprises Act, evaluated physician directory consistency across major databases. The top-performing source achieved roughly 86% address accuracy. The worst widely used directories held correct contact information for fewer than half of confirmed physician locations. That is the spread analytics teams are quietly inheriting when they buy off-the-shelf provider data.
The regulatory floor sits in the middle of that spread. CMS requires a minimum 85% directory accuracy for Medicare Advantage and ACA marketplace plans. Failure triggers a progressive enforcement framework: warning letters, then corrective action plans, then enrollment freezes during critical growth periods, then potential plan termination (CMS / Quest Analytics, July 2024 guidance). The math is uncomfortable. If the top commercial sources hit 86%, and the floor for compliance is 85%, then roughly half the market sits below the line.
The cadence rules under the No Surprises Act sharpen this further. Payers must verify provider directories every 90 days and reflect provider-submitted updates within 2 business days; violations can carry fines of up to $10,000 per violation (Atlas Systems and ProviderTrust analyses of NSA enforcement, 2024).
The anti-pattern: intern-army verification. We have walked into payer ops teams running this play unironically. Thirty to forty college interns each summer, each handed a stack of provider records and a phone, asked to call practices and confirm whether the listed physicians are still there. It does not scale. It has no audit trail per record. It decays in weeks once the interns leave. It cannot hit the NSA 90-day cadence at scale. It is the single most common manual-process failure pattern we see when we audit an analytics layer that is not hitting freshness.
| Accuracy band | Where it sits | Regulatory consequence |
|---|---|---|
| 86%+ (top-tier) | At or above CMS floor | Within compliance; routine audit |
| 50 to 85% (middle of market) | Below CMS 85% threshold | Warning letters, corrective action plans, enrollment freeze risk |
| Under 50% (bottom band) | Substantially below floor | Up to $10K per violation; plan-termination exposure |
Q: Why is provider-data freshness the silent killer of healthcare analytics?
A: Top-performing directory sources hit ~86% accuracy. CMS requires 85%. The market median sits below the line. The cadence rules under the No Surprises Act demand 90-day verification and 2-business-day updates, with fines up to $10K per violation. Pipelines that report green on row counts but ship stale records fail compliance and fail decisions simultaneously.
Expert Insights
The freshness problem is not solvable with manual verification. The intern-army approach is the most common anti-pattern we see in the field, and it fails on every axis that matters: scale, cadence, audit trail, and cost-to-correct. Combine the 86% top-source ceiling, the 85% CMS floor, the 90-day verification cadence, the 2-day update SLA, and the $10K/violation exposure, and the conclusion is unavoidable: freshness has to be an automated regime with per-record audit, not a hygiene project.
The affiliation graph as the spine of healthcare analytics
If you take one mental model from this article, take this one: the affiliation graph is the spine. Every durable analytics question, market sizing, M&A diligence, network adequacy, referral leakage, lands on the same graph problem. Resolve the provider to the practice. Resolve the practice to the facility. Resolve the facility to the group. Resolve the group to the IDN or system. Get the graph right, and the analytics get easier. Get the graph wrong, and every downstream question inherits the wrongness.
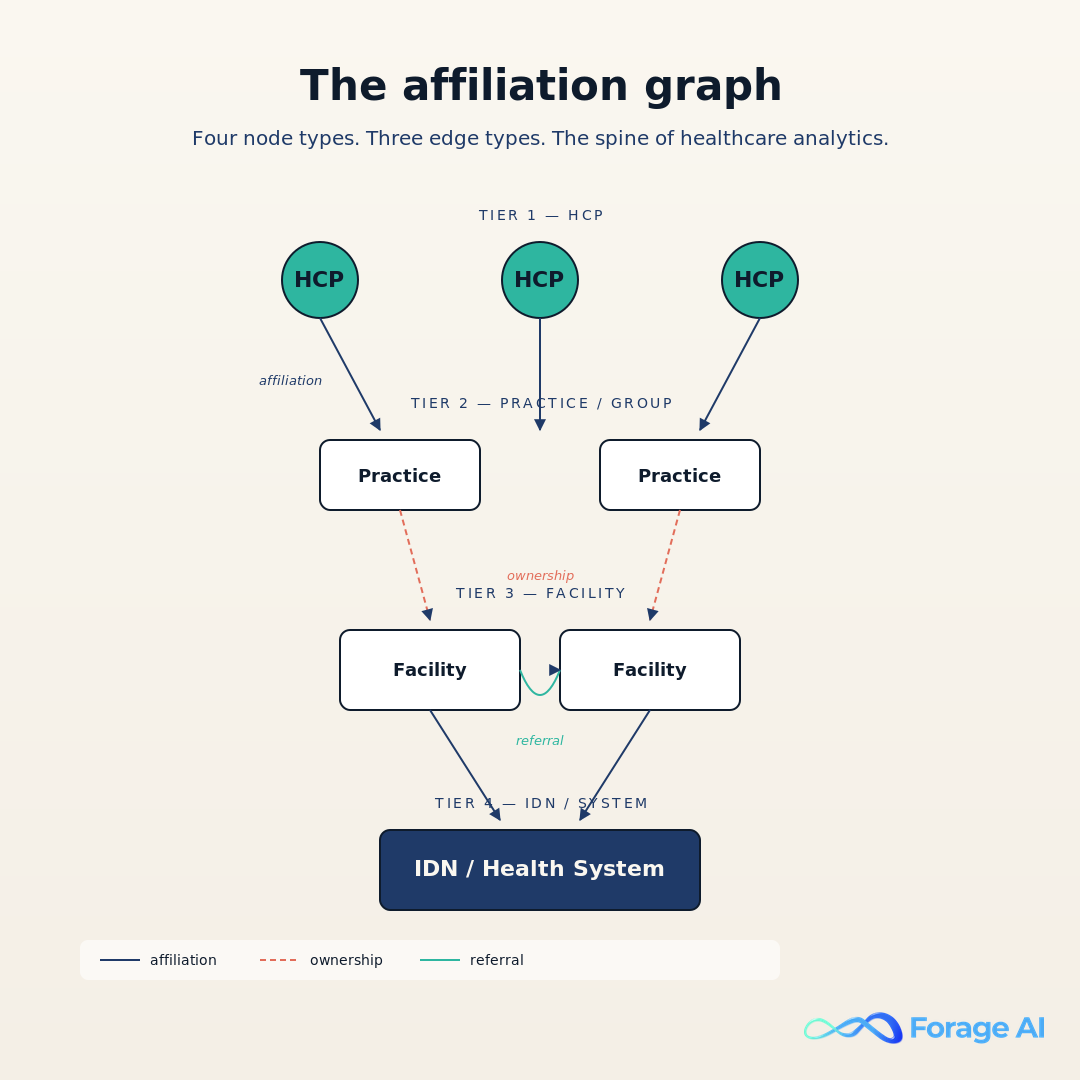
The nodes are well-bounded. Healthcare professional (HCP, NPI-anchored). Practice (the legal entity a physician bills under). Facility (the physical location). Group (the legal aggregator above practices, often the M&A unit). IDN or system (the corporate top of the tree). The edges are where the work is. Affiliation (an HCP is affiliated with a practice). Ownership (a system owns a facility, a group owns a practice). Referral (a primary-care affiliate refers to a specialist).
Reference and affiliation data is used to grow business, with health systems and IDNs using affiliation data to understand “affiliations, leadership, and performance” of provider relationships. Definitive Healthcare (2026)
The graph is hard at scale for three reasons we keep solving. Name variations: “Dr. Robert J. Smith, MD” and “Robert Smith, M.D.” resolving to the same NPI when the source files do not agree. Address moves: physicians change practice address several times per career; affiliation half-life on a moving physician is sub-quarterly. Affiliation half-life on the M&A side: 46 deals in 2025 means thousands of physician-to-group edges flipped that year, and each flip silently breaks downstream analytics if the graph does not catch it.
- NPI-anchored matching first. If both records carry a valid NPI, the NPI is the join key. Conflicts get versioned, not overwritten.
- Name + address fuzzy match. Levenshtein distance below threshold, Jaro-Winkler above threshold, with a per-specialty calibration on the threshold itself.
- Specialty and license cross-check. Same NPI claiming wildly different specialties or holding inconsistent state-license status moves the record to an “unresolved” bucket for human review, not to the active graph.
- Affiliation back-reference. A new affiliation that contradicts the existing graph forces a re-resolution at the practice and facility tier, not just at the HCP tier.
The unresolved bucket is the most important piece. A graph that “resolves” every record by force is a graph that is silently wrong. A graph that holds an unresolved bucket, sizes it, surfaces it on a dashboard, and resolves it on a cadence is a graph an analytics team can trust.
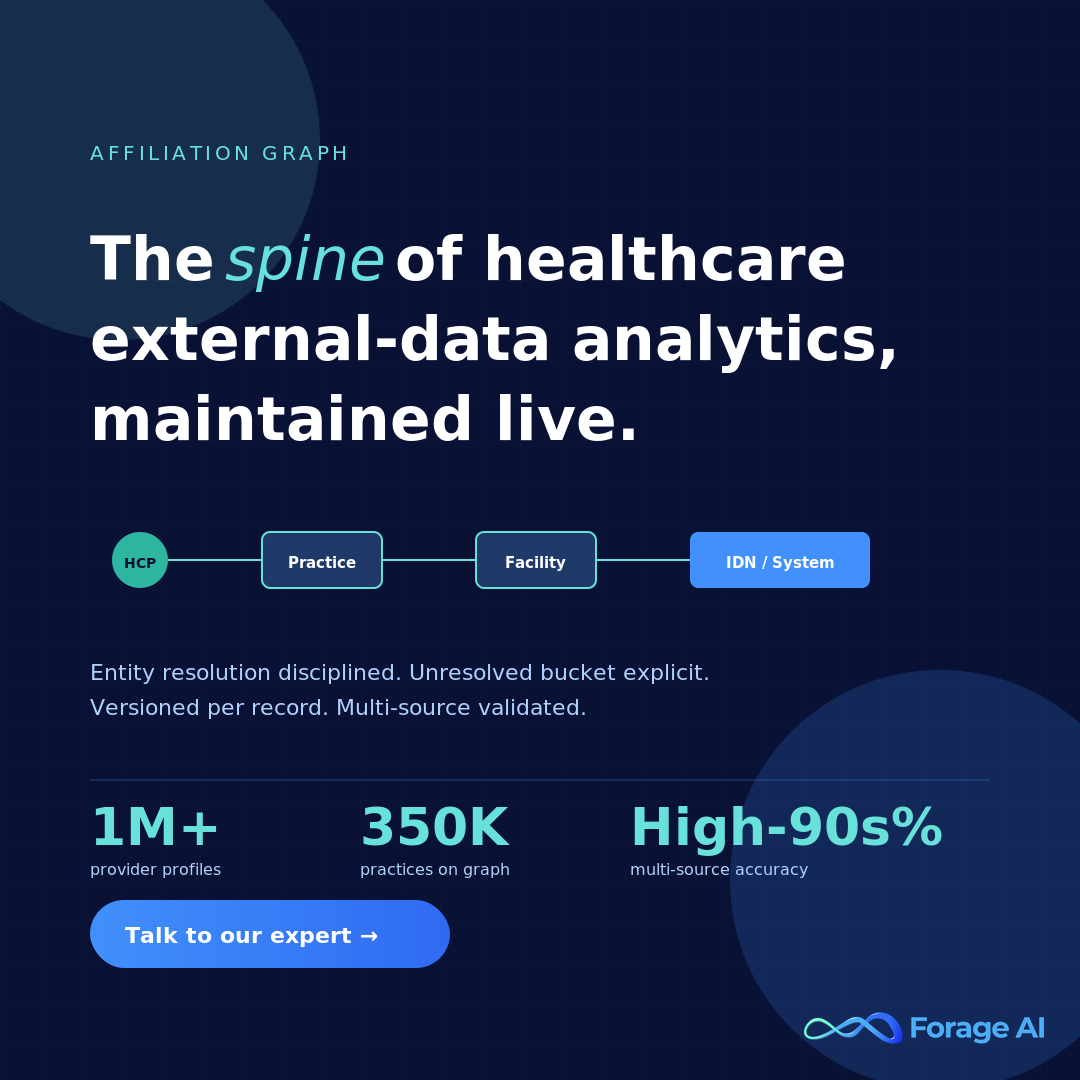
This is the layer where Forage AI’s healthcare extraction work plugs in directly: keeping the four-tier graph live, with the unresolved bucket sized and explicit, every record versioned, every change traceable to a source extraction. The pain point this attaches to: analytics teams burning weeks of cycles building affiliation joins manually from disagreeing source files. The graph as a maintained asset removes that work and removes the silent-staleness failure mode underneath it.
Q: Why is the affiliation graph the spine of healthcare external-data analytics?
A: Because every durable analytics question (M&A, market share, network adequacy, leakage, cohorting) ultimately resolves to “this HCP is at this practice, which is owned by this group, which sits inside this IDN.” Get the graph right, the analytics get easier. Get it wrong, every downstream question inherits the wrongness.
Expert Insights
The graph problem is structurally hard for three reasons: name variations (same physician spelled five different ways across sources), address half-life (practices move, physicians move between practices), and M&A churn (with 46 hospital deals in 2025 plus group-practice acquisitions one tier below, thousands of edges flip per year). Entity resolution rules have to be NPI-anchored, fuzzy at the name-and-address layer, cross-checked against specialty and license, and back-referenced against the existing graph. The unresolved bucket is not a defect; it is the integrity signal.
The analytics workflow on external data, end to end
The graph is the asset. The workflow is how the asset gets built and kept current. The six-stage pattern we run is below. We have run variations of this pattern at customers ranging from forty-person product teams to multi-thousand-person payer organizations, and the stages stay the same. What varies is the tooling at each stage and the audit obligations on top.
- Landing. Raw extraction output lands in an immutable zone, partitioned by source and extraction date. Every record carries a source URL, a timestamp, an extraction-job ID, and a content hash. This is the audit floor.
- Normalization. Source-shaped records (HTML tables, JSON blobs, PDFs, vendor exports) get coerced into a common schema per data type. Provider records into one shape, organizational-event records into another, affiliation deltas into a third.
- Entity resolution. The rules from the previous section run here. NPI-anchored matching, name-and-address fuzzy, specialty cross-check, affiliation back-reference. Resolved records flow forward; unresolved records flow to the explicit bucket.
- Enrichment. Resolved records get joined to the affiliation graph, to claims-derived attributes, to organizational events on a temporal axis. This is where a flat “physician record” becomes an entity with affiliations, history, and event context.
- Analytics-ready model. Enriched records get modeled into the dimensional shapes the BI layer queries. Provider dimension, practice dimension, facility dimension, affiliation fact, event fact. Slowly-changing dimensions per record so the graph is queryable as-of any historical date.
- BI / serving. The analytics-ready model gets served to BI tools, to internal analytics APIs, and (for customers running ML on top) to feature stores. The serving layer is the only place external consumers touch the data.
Three audit boundaries cross-cut these stages. One at landing → normalization (what raw record produced what normalized record). One at entity resolution (which source records resolved to which graph node, and on what rule). One at analytics-ready (which graph state, on what date, produced which served row). These boundaries are how a compliance reviewer reconstructs a number on a dashboard back to its source.
The anti-pattern: spreadsheet-as-warehouse. Quarterly Excel pull from a vendor portal, joined to last quarter’s Excel pull, with VLOOKUP fixing the joins. Stale by month two. No entity resolution, so the join keys silently drift. No graph, so M&A and leakage questions cannot be answered at all. No audit trail, so a number on the executive deck cannot be reconstructed when someone asks how it was built. We see this pattern at companies that have raised significant rounds and have several quarters of strategic decisions sitting on top of it. It is fixable. It is also expensive to leave in place.
Q: What is the end-to-end workflow for an external-data analytics layer in healthcare?
A: Six stages: landing (immutable, audit-floored), normalization (source-shaped → common schema), entity resolution (NPI-anchored with explicit unresolved bucket), enrichment (joins to graph, claims, events), analytics-ready model (dimensional, slowly-changing per record), and BI/serving. Three audit boundaries cross-cut the stages so any served number can be reconstructed back to its source.
Expert Insights
The single most-common failure pattern at this layer is the spreadsheet-as-warehouse anti-pattern: quarterly Excel pull from a vendor, joined to last quarter’s pull, with no entity resolution and no audit trail. It survives because the first wrong number does not show up for several months. The fix is structural, not tactical: every record gets a source ID, a timestamp, and a hash at landing; every resolution rule is logged; every served number can be reconstructed back to the source extraction job.
Where Forage AI sits in this stack
We sit at the acquisition, freshness, and affiliation-graph layers. Stages one through four of the workflow above. The analytics-ready model and the BI layer (stages five and six) we leave to the customer’s analytics team or to their BI vendor of choice, because those layers carry product-specific modeling that belongs in-house.
Two deployment-shape choices matter more than any other when an analytics team is evaluating an acquisition partner. Sovereign-by-design: the extraction pipeline runs in a deployment posture that survives a compliance review. HIPAA-aligned. BAA-ready. On-premise available. No third-party LLMs in the extraction path. The reason that matters: most general-purpose extraction tooling routes content through commercial LLM APIs, which introduces a data-handling footprint that healthcare compliance teams will not sign off on. Trustworthy by mechanism: real-time refresh on the records that need it, multi-source validation per record, per-record audit trail, affiliation-graph maintenance as a continuous operation rather than a quarterly batch.
Stat Callout. Forage healthcare coverage (Q2 2026). Our healthcare provider data runs at 1M+ provider profiles at 99.7% accuracy, across 350K+ practices.
The output shape is structured for analytics consumption. Provider records carry resolved NPI, practice attribution, facility attribution, current affiliations, historical affiliations with effective dates, payer-mix attribution where derivable, and a per-record source audit trail. Organizational events carry resolved entity references, source URLs, extraction timestamps, and event-type classification. Everything is queryable as-of any historical date, which is what makes the layer defensible in front of an audit.
If you want the buyer-side comparison view of the analytics-data market, our piece on top healthcare data extraction services is the place to start. And the strategic argument under all of this, why structured external-data extraction becomes a defensive moat in healthcare rather than a commodity input, is laid out in AI-powered document processing builds a defensive moat in healthcare.
Q: Where does Forage AI plug into the external-healthcare-data analytics stack?
A: At stages one through four: acquisition, normalization, entity resolution, and affiliation-graph enrichment. Sovereign-by-design deployment (HIPAA-aligned, BAA-ready, on-premise available, no third-party LLMs in the extraction path). Output shape is structured for analytics consumption with per-record audit and historical-state queryability.
Expert Insights
The reason Sovereign-by-design matters in healthcare specifically is that the alternative shape (extraction pipelines that route content through commercial LLM APIs) introduces a third-party data-handling footprint that healthcare compliance will not sign off on. The pain we hear from analytics leads on procurement calls: their preferred extraction vendor cannot pass the compliance review, so they end up with a worse-performing vendor that can, and the analytics layer inherits the gap. Sovereign deployment removes that tradeoff.
Compliance posture for analytics teams
The compliance lift for external-data analytics is real but it is bounded. The reviewer is going to ask three questions about any record on any dashboard. Where did this data come from. Who saw it. On what cadence is it refreshed. A defensible analytics stack has answers per record, not per quarter.
Where did it come from. Source URL, extraction job ID, timestamp, and content hash on every record at landing. Entity-resolution decisions logged with the rule that fired and the confidence score. Affiliation-graph state versioned per change.
Who saw it. Access logs at the serving layer, scoped per user and per dataset. The non-PHI nature of the underlying data makes this lift lighter than clinical analytics, but it is not zero. Cohorting outputs (which may be commercially sensitive even if not patient-sensitive) need access controls.
On what cadence is it refreshed. This is the question that comes back to the freshness section. CMS requires 85% directory accuracy; NSA requires 90-day verification and 2-business-day update on payer-facing directories; violations carry fines of up to $10K each (as of 2024 guidance). The compliance posture has to be: per-record freshness telemetry, dashboarded, with alerting on staleness above defined thresholds.
The HIPAA boundary is worth restating. External-data analytics on non-PHI sources does not require a BAA for the source data itself. The moment any PHI-adjacent data enters the pipeline (a payer is sharing claims with member identifiers, for example), the extraction layer needs to be BAA-ready. Sovereign-by-design deployment is what makes the BAA-readiness real rather than aspirational.
CMS’s progressive enforcement (warning letters → corrective action → enrollment freezes → termination) has shifted directory accuracy from a back-office hygiene problem to an enterprise risk. Quest Analytics synthesis on the CMS enforcement framework (2024)
Forage AI’s posture at this layer attaches to a specific pain: analytics teams whose preferred extraction stack cannot pass compliance review, leaving them either underperforming or non-defensible. Sovereign deployment removes the tradeoff so the analytics layer can stay defensible in front of a compliance reviewer without trading away pipeline quality.
Q: What compliance posture does an external-healthcare-data analytics team need to bring to procurement?
A: Three answers per record, not per quarter: where did the data come from (source ID + timestamp + hash), who saw it (access logs at serving), and on what cadence is it refreshed (per-record freshness telemetry mapped against CMS 85%, NSA 90-day verify, 2-day update). For PHI-adjacent inputs, the extraction layer must be BAA-ready, which Sovereign-by-design deployment makes real.
Expert Insights
The compliance reviewer’s three questions (source, access, cadence) are knowable in advance. The cost of building the answer per record at landing is small. The cost of retrofitting it onto a dataset that has been running for two years without it is large. We have done the retrofit. We do not recommend it. Build the audit layer at landing and the compliance review becomes a paperwork exercise instead of a re-architecture.
A reference architecture, end to end
The previous sections walked the stages and the compliance posture independently. The reference architecture is how they fit together as a single picture.
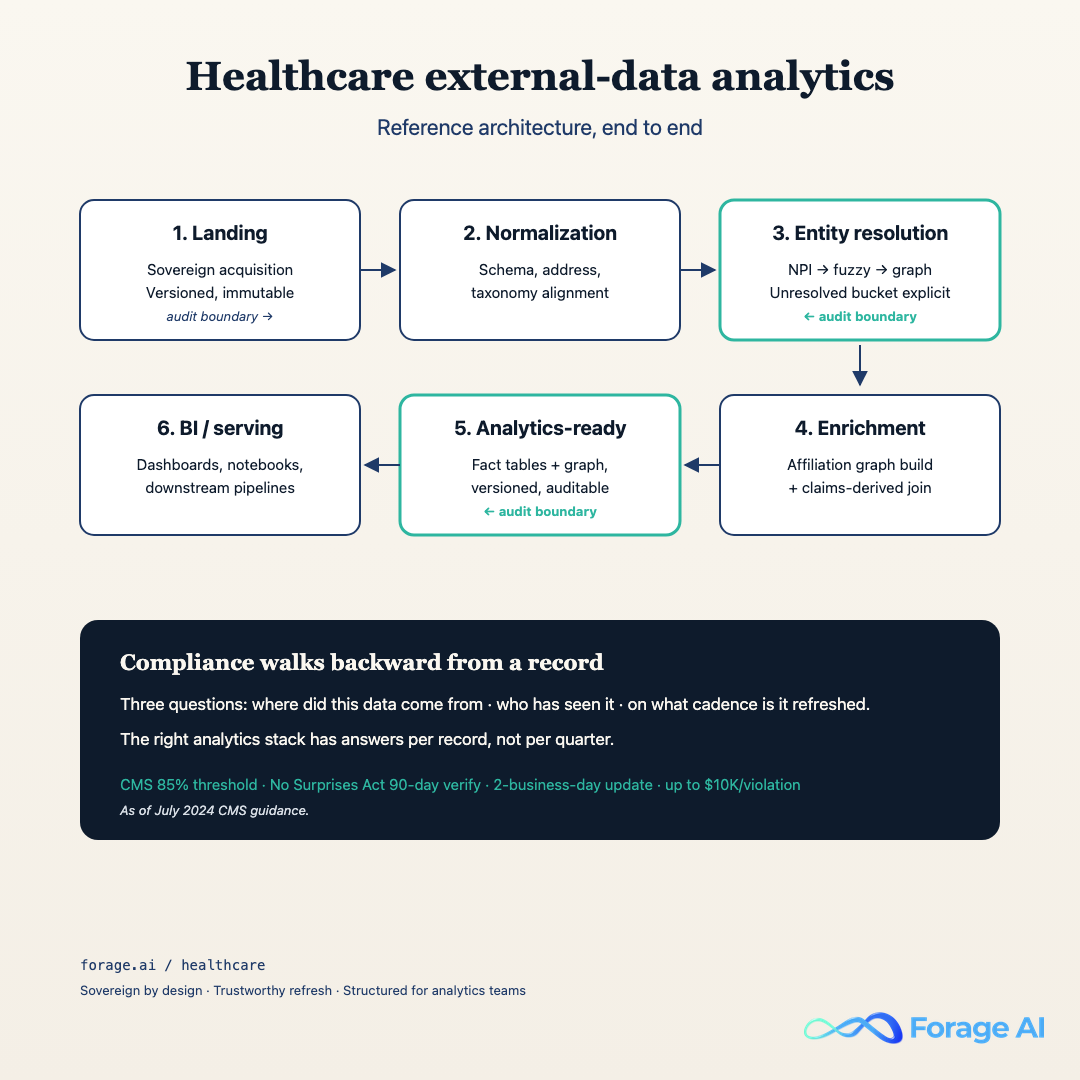
Walking the diagram left to right. Sovereign acquisition sits at the front, pulling from vendor APIs, regulatory registries (NPI, state license boards, CMS files), payer directories, IDN websites, news and event sources. Output lands in an immutable landing zone, partitioned by source and date, with per-record source-URL, timestamp, job-ID, and content-hash provenance. Audit boundary one sits between landing and normalization.
Normalization coerces the source-shaped records into common schemas per data type. Entity resolution runs the NPI-anchored, fuzzy, cross-checked rule set from H2-5. Resolved records flow forward into enrichment; unresolved records flow into the explicit unresolved bucket with sizing and alerting. Audit boundary two sits at entity resolution, logging which source records resolved to which graph node and on what rule.
Enrichment joins resolved records to the affiliation graph, claims-derived attributes, and organizational events on the temporal axis. The analytics-ready model is dimensional, with slowly-changing dimensions on every entity so the graph is queryable as-of any historical date. Audit boundary three sits between analytics-ready and serving, so any number on any dashboard can be reconstructed back through the model to the source extraction job.
Serving is where BI tools, internal analytics APIs, and (for the ML-on-top customers) feature stores connect. This is the only layer external consumers touch. Everything upstream is private to the pipeline.
The shape is deliberately boring. We have tried more elaborate architectures and the boring shape wins every time on three metrics that matter: time-to-onboard a new data source, time-to-reconstruct an audited number, and time-to-fix a stale record. The six-stage / three-audit-boundary pattern hits all three.
Q: What does an end-to-end reference architecture for healthcare external-data analytics look like?
A: Six stages (Sovereign acquisition → normalization → entity resolution → enrichment → analytics-ready model → BI/serving) with three audit boundaries (landing→normalization, entity resolution, analytics-ready→serving). The shape is deliberately boring because boring wins on time-to-onboard, time-to-reconstruct, and time-to-fix.
Expert Insights
The architecture is one diagram, not a stack of frameworks. Every box maps to a stage from H2-6, every audit boundary maps to a compliance question from H2-8, and every output type maps to a use case from H2-3. When we onboard a new healthcare customer, we walk this picture in the first technical call, then we mark which boxes the customer already has, which boxes Forage will deliver, and which boxes belong to their BI vendor. The picture is the working contract.
What to ask a healthcare external-data vendor before signing
The eight questions below are the ones we wish more analytics-side buyers asked us during procurement (and the ones we know our customers ask other vendors). Each row has the question, why it matters, and the red-flag answer to watch for. For the buyer-side companion to this list, see our guide on how to evaluate healthcare data providers on coverage, compliance, and freshness.
| # | Question | Why it matters | Red-flag answer |
|---|---|---|---|
| 1 | What is the refresh cadence per data type, per record? | NSA requires 90-day verify and 2-day update on payer-facing directories. Quarterly batch refresh fails the cadence. | “We refresh quarterly” or “we refresh the dataset on customer request.” |
| 2 | What does the per-record audit trail contain? | Compliance reviewers will ask. Per-record source URL, timestamp, job ID, and content hash is the floor. | “We can pull source on request” or audit at the dataset level, not record level. |
| 3 | What is the entity-resolution methodology? | The graph is the spine. NPI-anchored matching with fuzzy, specialty, and affiliation back-reference is the working pattern. | “We use proprietary AI matching” with no methodology disclosure, or no unresolved bucket. |
| 4 | How deep does the affiliation graph go, and how is it maintained? | Four tiers (HCP → practice → facility → IDN) is the floor. Maintenance has to be continuous, not annual. | Three tiers or fewer. Annual or quarterly affiliation refresh. |
| 5 | What deployment options exist, and is Sovereign / on-premise available? | Compliance review will not pass extraction stacks that route through third-party LLM APIs. | Cloud-only, no Sovereign or on-prem option. |
| 6 | What is the BAA posture for PHI-adjacent data? | Once PHI-adjacent inputs enter the pipe, BAA is mandatory. | “BAA available with enterprise tier” with no detail, or no BAA offered. |
| 7 | What are the integration paths to our analytics stack? | The serving layer matters. SQL warehouse, REST API, feature store, BI direct: pick at least two. | Single export format (CSV) or no programmatic access. |
| 8 | What is the support model and SLA? | 24/7 for payer-facing freshness obligations. Named technical contact for analytics teams. | Email-only support, no SLA, or business-hours only for production data. |
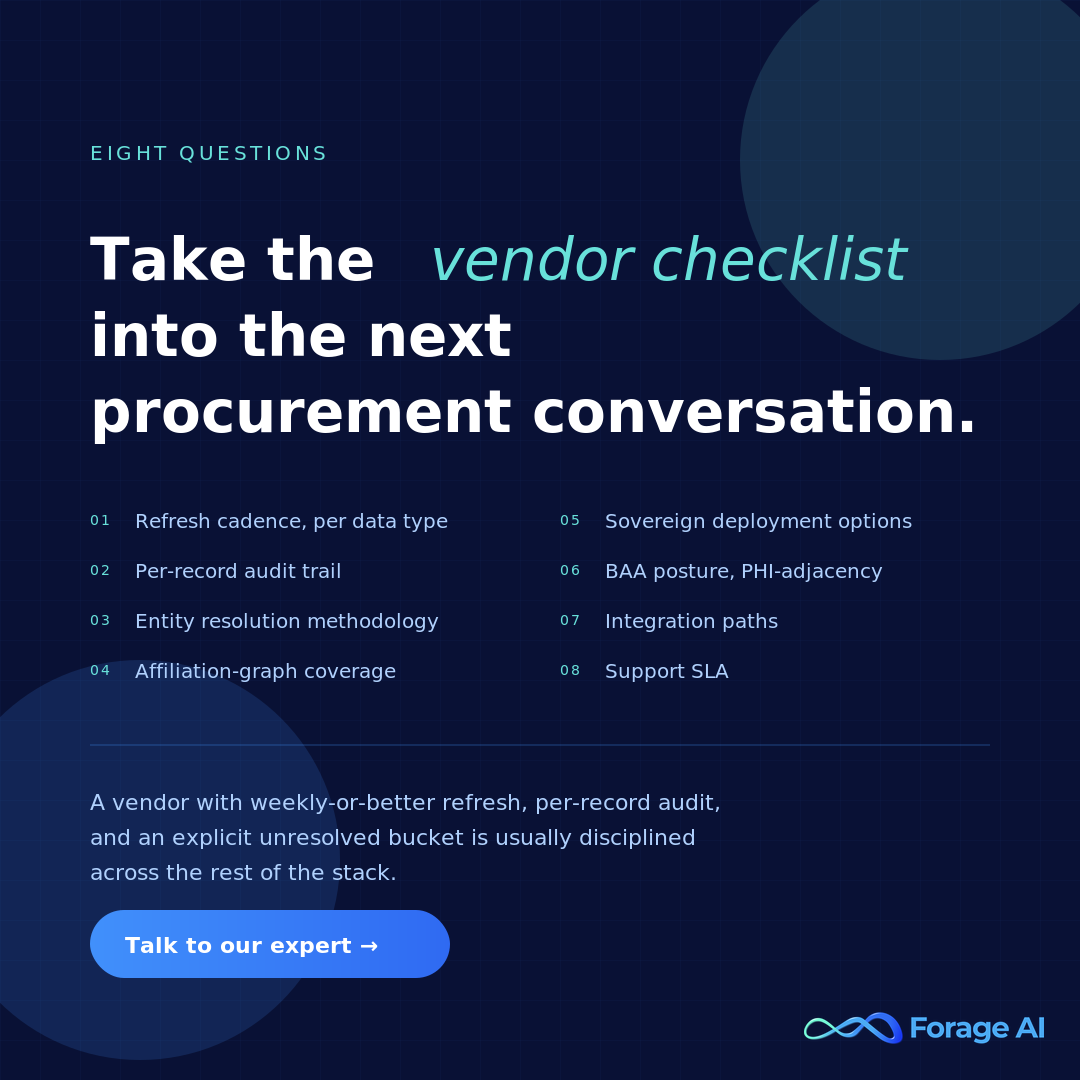
A practical note. Most vendors will answer most of these questions on the first call. The signal is which questions trip them up, not which questions they ace. Refresh cadence and audit trail are the two that separate practitioner-grade vendors from marketing-grade vendors most reliably.
Q: What should an analytics-side buyer ask a healthcare external-data vendor before signing?
A: Eight questions: refresh cadence per record, per-record audit trail, entity-resolution methodology, affiliation-graph depth and maintenance cadence, Sovereign / on-premise deployment options, BAA posture for PHI-adjacent data, integration paths into the analytics stack, and support model with SLA. The signal is which questions the vendor stumbles on, not which they ace.
Expert Insights
The two questions that separate practitioner-grade from marketing-grade vendors are refresh cadence per record (not per dataset) and per-record audit trail contents. Vendors that have built for compliance review answer both in detail in the first call. Vendors that have not will pivot to “we can discuss that with our solutions team,” which is the polite version of “the answer is not what you want it to be.” Take the checklist into the conversation and listen for the pivots.
FAQ
What is healthcare data analytics, and how is it different from clinical analytics?
Healthcare data analytics is an umbrella covering clinical, operational, and external-data analytics. Clinical analytics runs on PHI and powers treatment-decision use cases (risk modeling, readmission prediction, value-based-care performance). External-data analytics runs on non-PHI inputs (provider directories, affiliations, organizational events, claims-derived attributes) and powers market, competitive, M&A, and network use cases. They are different stacks with different audiences, different regulatory regimes, and different vendor ecosystems. This article is about the external-data layer.
How do healthcare organizations actually use data analytics on external data?
Five durable use cases. Market sizing answers how many providers in a specialty serve a geography under a given payer-mix. M&A and affiliation tracking answers which provider groups are moving between systems and what physician panels are worth in a deal (with 46 hospital deals and 43% distressed in 2025, the diligence intensity per deal is high). Competitive intelligence on provider behavior tracks switching, new affiliations, and volume shifts. Cohorting for BD builds outreach lists keyed to provider attributes. Network adequacy and referral leakage answer regulatory and operational questions about whether a network can serve its members and where referrals leak outside it. See H2-3 for the per-use-case input and cadence breakdown.
How can healthcare data analytics help with patient or referral leakage?
Referral leakage is fundamentally an affiliation-graph question. A primary-care affiliate sees a patient, refers to a specialist, and the question is whether that specialist sits inside or outside the system’s affiliated network. Answering it at scale requires a four-tier affiliation graph (HCP → practice → facility → IDN), real-time refresh on the affiliation edges (because physicians move and groups get acquired), and joins to claims-derived volume attributes so the leakage volume can be sized. The same pattern serves network adequacy on the payer side: the regulatory question is whether the network has a provider within X miles for every member zip; the graph is the substrate the answer runs on.
What should I ask a healthcare data analytics vendor before signing?
The eight questions from H2-10. Refresh cadence per record (not per dataset). Per-record audit trail contents. Entity-resolution methodology including how the unresolved bucket is handled. Affiliation-graph depth (four tiers minimum) and maintenance cadence. Deployment options including Sovereign / on-premise. BAA posture for PHI-adjacent data. Integration paths into your analytics stack. Support model and SLA. The two that separate practitioner-grade from marketing-grade vendors most reliably are refresh cadence per record and per-record audit contents; listen for the pivots.
How does directory freshness affect compliance and what is the actual penalty exposure?
CMS requires 85% directory accuracy for Medicare Advantage and ACA marketplace plans. The progressive enforcement framework runs warning letters → corrective action plans → enrollment freezes → potential plan termination. The No Surprises Act adds a 90-day verification cadence and a 2-business-day update SLA on payer-facing directories, with fines of up to $10,000 per violation. The AJMC peer-reviewed work (2024) showed top-performing sources hit ~86% accuracy and the worst widely used directories hold correct contact info for fewer than half of physician locations. So the floor and the ceiling are close together, and most of the market sits below the line.
Related Articles
- Healthcare Data Extraction: How Health Data Teams Automate Provider, Claims, and Clinical Data
- Healthcare Data Management: How Health Organizations Automate Data Pipelines
- Real Estate Data Analytics: How Property Teams Automate Market Intelligence
- Claims Processing Automation: How Insurers Reduce Manual Review and Accelerate Payouts
- AI-Powered Document Processing Builds a Defensive Moat in Healthcare
Building the external-healthcare-data analytics layer described above cost us about three engineering-quarters of internal work the first time we did it for a customer, distributed across acquisition, entity resolution, the affiliation graph, and the audit layer. Maintaining it costs roughly four to six engineering-hours per week per customer pipeline at steady state. What it removes from the customer side is a different shape of cost entirely: the analytics team no longer spends weeks per quarter reconciling stale directories, hand-building affiliation joins, and reconstructing audit answers under deadline pressure. About three engineering-quarters of our time per build, four to six hours per week to maintain. Required zero hours of the customer’s analytics team after onboarding, which is the only line on the spreadsheet that matters when the VP of Data is the one signing the renewal.
Written by Sai Subramaniam, Forage AI.